这篇文章在清醒猕猴的上颞沟(superior temporal sulcus, STS)下岸——中央下颞皮层(inferior temporal cortex, IT)后部 TE 区——做单细胞记录,专门追问"物体表面光泽"(surface gloss)这种材质属性是否有专门的神经表征。作者用 MERL BRDF 数据集里 33 种真实材质的双向反射分布函数(bidirectional reflectance distribution function, BRDF)渲染物体图像,把镜面反射、漫反射、粗糙度三个物理参数系统铺开,找到了一批对特定光泽选择性响应的神经元,并证明其选择性跨形状、跨照明保持,而像素打乱后消失。它把"材质知觉的神经基础"从人类 fMRI 定位推进到了单细胞层面的群体编码。
研究背景
看物体时,外观主要由表面反射特性决定:光泽传达材质成分与表面细微结构的信息,是材质识别的关键线索。人类 fMRI 已发现腹侧高级视觉区在注意或辨别材质时被激活(Cant 与 Goodale 等),猴 IT 皮层里也已知有对面孔、纹理、颜色选择性响应的神经元,STS 内还有编码三维形状(来自立体视差与纹理梯度)和光照方向的细胞,且 Okazawa 等 2011 年的猴 fMRI 显示 STS 区域能区分光泽与哑光表面。这些线索汇聚起来指向 STS 是寻找"光泽神经元"的理想位置。
但当时缺的是单细胞层面的直接证据:fMRI 激活不等于存在真正编码光泽的神经元;此前仅有的两份材质选择性细胞研究(V4 的 Arcizet 2008、IT 的 Köteles 2008)用的是 CUReT 数据集的真实材质图像,材质自带三维中尺度表面结构(mesostructure),选择性可能来自复杂纹理明暗而非反射特性本身。所以"是否存在不依赖表面纹理、真正编码反射特性/光泽的神经元"仍是缺口,光泽在群体水平如何被表征更是无人回答。
研究思路
作者的策略是造一套"物理参数可控、又贴近真实"的刺激:从 MERL BRDF 数据集(约 100 种实测材质)中选出 33 种表面反射特性,用 Ward–Duer 模型以漫反射率(ρd)、镜面反射率(ρs)、粗糙度(roughness, α)三个参数渲染到 10 种 LightWave 三维形状上,默认光照为 Eucalyptus Grove 高动态范围环境光。关键在于这套材质没有宏观表面起伏,剥掉了纹理明暗的混杂,使选择性可以归因于反射特性。整个逻辑链分三步:先证明存在光泽选择性神经元;再用两个对照把"低层特征解释"逐一排除——换三维形状(局部亮度图案全变而光泽知觉不变,选择性应保持)与像素打乱(亮度/颜色直方图不变而光泽知觉被破坏,选择性应消失)——符合这两条标准的才叫光泽选择性(gloss-selective)神经元;最后用群体反应的相关距离做多维标度(multidimensional scaling, MDS),看光泽在群体活动中是否被系统性排布。
方法
两只日本猕猴(AQ 与 TV,一雄一雌,5.8–6.2 kg),在三个半球上记录。先手术植入头架与记录室,用钨微电极在 STS 下岸(后 TE,坐标 A4–A16、L18–L26,未探查外侧凸面)广泛扫图,再向常见到光泽响应的区域插入 MRI 兼容引导管(钛/金),记录位置经 MRI 确认。动物做注视任务:注视点出现后每 300 ms 呈现一次刺激、共 5 次,间隔 300 ms,最后一个刺激熄灭后 300 ms 给果汁奖励,眼位须保持在 2.6°×2.6° 窗内;物体约 5° 视角,通常呈现在中央凹(反应弱时改用外围位置,共 27/215 个神经元、6/57 个光泽选择性神经元如此处理)。
分析上,反应取刺激 onset 后 50 ms 起 300 ms 的平均放电率减基线;入选要求 ≥10 spikes/s 且至少对 1 个刺激反应显著(p≤0.05)。先用预实验刺激集(15 种反射特性 × 10 形状)确定每个神经元的最优形状,再用最优形状下的 33 种表面反射做主实验,以方差分析(ANOVA)检验选择性,选择性指数(selectivity index)= 1 − 最小反应/最大反应,稀疏性指数(sparseness index)衡量反应在刺激集上的不均匀程度。换形状对照计算最优形状与非最优形状反应的相关系数并做双因素 ANOVA;像素打乱对照则随机重排轮廓内像素。判定光泽选择性神经元用两条标准:(1) 对非最优形状有反应且两种形状下的选择性模式显著相关;(2) 对打乱刺激无显著反应或其选择性模式与最优形状不相关。另用可分离性指数(separability index,对反应矩阵做奇异值分解,以第一主成分预测值与实际反应的 r² 衡量光泽×形状是否可分)配置换检验(permutation test,1000 次)。群体编码用 57 个光泽选择性神经元对所有刺激对的反应相关(1−r 为神经距离)做非度量 MDS。
主要结果
- STS 下岸存在对特定光泽选择性响应的神经元。共扫查 101 个位置、记录 215 个对光泽刺激集有反应的神经元,其中 194 个表现出显著选择性;按双标准最终判定 57 个为光泽选择性神经元(AQ 31 个、TV 26 个)。示例神经元各有偏好:cell 1 强烈响应锐利高光(大 ρs、小 α),cell 2 响应模糊高光的亮面物体(大 ρs、大 α),cell 3 响应哑光物体(图 4)。
- 选择性不依赖形状而依赖光泽知觉本身。换形状后反应模式高度相关(cell 1 r=0.86、cell 2 r=0.82、cell 3 r=0.87;群体 118/145=81% 显著相关,可分离性指数平均 0.86±0.08,仅 1 个神经元的第二主成分显著);像素打乱后,按原刺激偏好排序的群体反应曲线接近平坦,表明原有选择性大幅减弱。57个光泽选择性神经元中仍有27个对打乱刺激显著响应,但其中仅2个具有显著排序斜率;群体曲线仍有微小但显著的负斜率,提示平均颜色或亮度可能残留轻微影响。(cell 1 最大仅 1.71 spikes/s,群体排序曲线近平坦)(图 5、6、7、9)。
- 光泽选择性神经元的选择尖锐且统计稳健:选择性指数中位数 1.02(多数 ≥0.6),稀疏性指数中位数 0.43(多数 ≥0.3);最优与非最优形状的选择性强度无差异(1.03±0.18 vs 1.02±0.18);最佳与最差刺激下眼位方差仅 1 个神经元有差异,眼动不能解释选择性(图 8)。
- 偏好因细胞而异,群体上系统偏向"亮"。群体归一化平均反应最大与最小之比为 2.18(刺激 13 对刺激 33),光泽越强反应越强的倾向明显;峰值刺激多落在高 ρs、低 α 区域,小 ρs 刺激较少成为峰值(图 10)。
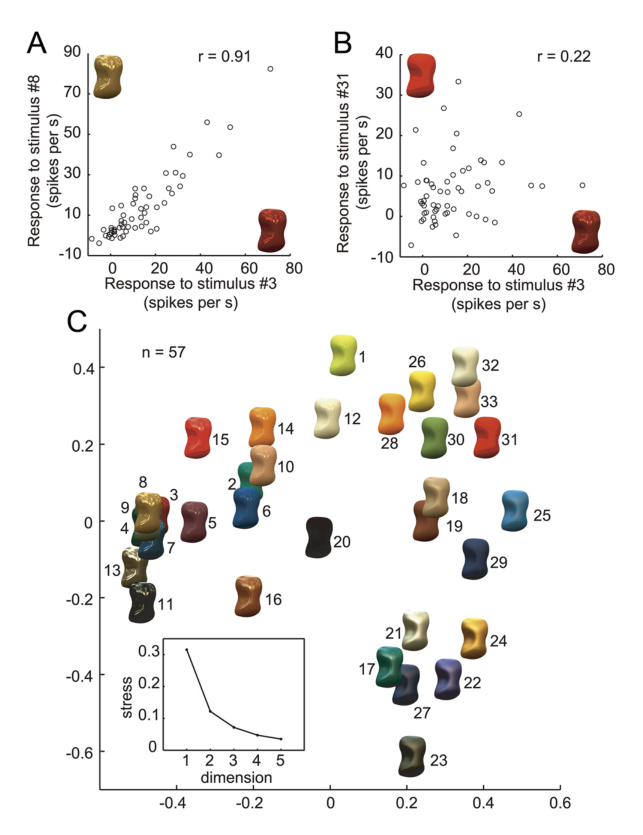
- 跨照明不变、群体二维系统表征。换用 Campus at Sunset 照明后,48 个受测神经元中 40 个(83.3%)的反应模式与默认照明显著相关,可分离性平均 0.84±0.1(仅 2 个第二主成分显著)(图 11、12);MDS 显示二维即足以概括群体反应的神经距离(stress 0.12)——高镜面刺激聚在左侧、模糊高光刺激聚在右下、哑光聚在右上,与 Ferwerda 等 2001 年知觉光泽空间的两轴(contrast gloss 与 distinctness of image reflections)系统对应;类似光泽的刺激对(3 与 8)群体反应相关高达 r=0.92,光泽迥异的刺激对(3 与 31)仅 r=0.22(图 13)。
图注解读
图 1 · 光泽三参数与刺激集构造
原文图注:Figure 1. Gloss parameters and stimuli for assessing gloss selectivity. A, Schematic illustration of three reflection parameters: diffuse reflectance (ρd), specular reflectance (ρs), and roughness (α). When ρd increases, the lightness of the object increases. When ρs increases, the highlights become stronger. When α increases, the highlights become blurred. B, Example of a gloss stimulus set. The stimuli exhibit 33 types of surface reflectance selected from the MERL BRDF dataset and rendered on one of the shapes (shape 3) under default illumination (Eucalyptus Grove). Stimuli were ordered according to the magnitude of α. C, Ten object shapes used for the experiment rendered with surface 8 in B. D, Top, Example of a shuffled stimulus generated by randomizing the pixels within the contour. Bottom, Example of a stimulus rendered under different illumination (Campus at Sunset). ……
解读:A 面板是全文的物理坐标系——ρd 管整体明暗、ρs 管高光强度、α 管高光的弥散程度,三种参数组合出从黑哑光到亮镜面的连续外观;B 面板把 33 种表面按 α 排序展示在同一形状上,这就是"光泽刺激集";C 给出 10 种实验用三维形状,D 展示两类对照刺激(像素打乱、换照明),E 则把 33 种表面放进 ρd-ρs-α 三维"光泽刺激空间"——锐利高光在后左、模糊高光在后右、哑光在前右。这张图定义了后文所有分析的刺激坐标,读正文时应随时回到这个空间定位各神经元的偏好。
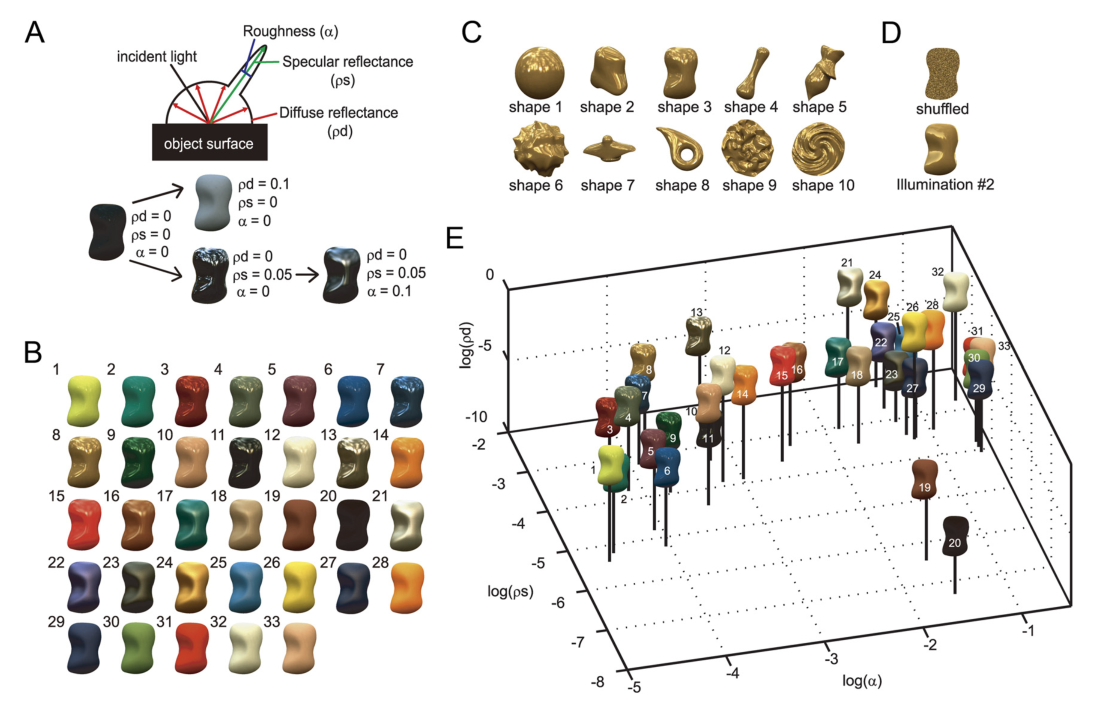
图 2 · 记录位点
原文图注:Figure 2. Recording sites. A, Schematic illustration showing the recording site within a lateral view of the monkey cerebral cortex (in red) and the approximate position of the recording chamber. B, An MRI image of a coronal section of the brain of monkey AQ positioned 8 mm anterior to the interaural line. A guide tube made of gold 650 μm in diameter is inserted targeting the lower bank of the STS in the right hemisphere. C, Top view of the areas of electrode penetration in the lower bank of the STS in three hemispheres are indicated by colored contours (red, monkey AQ right hemisphere; blue, AQ left; green, TV left) with stereotaxic coordinates. ……
解读:这张图回答"数据从哪儿来"。A 是侧视脑图上标出记录室与 STS 下岸的示意位置;B 用冠状 MRI 实拍展示金制引导管指向右半球 STS 下岸,说明记录位置有影像学证据而非仅靠立体定位坐标;C 在三个半球的穿透区俯视图上标出网格孔位置、对光泽刺激集有反应的神经元(灰圈)与光泽选择性神经元(彩色点)。正文结论的空间限定——"记录区比 Janssen 等的三维形状区更靠后,也与颜色集中区不同"——都以本图的位点分布为依据。
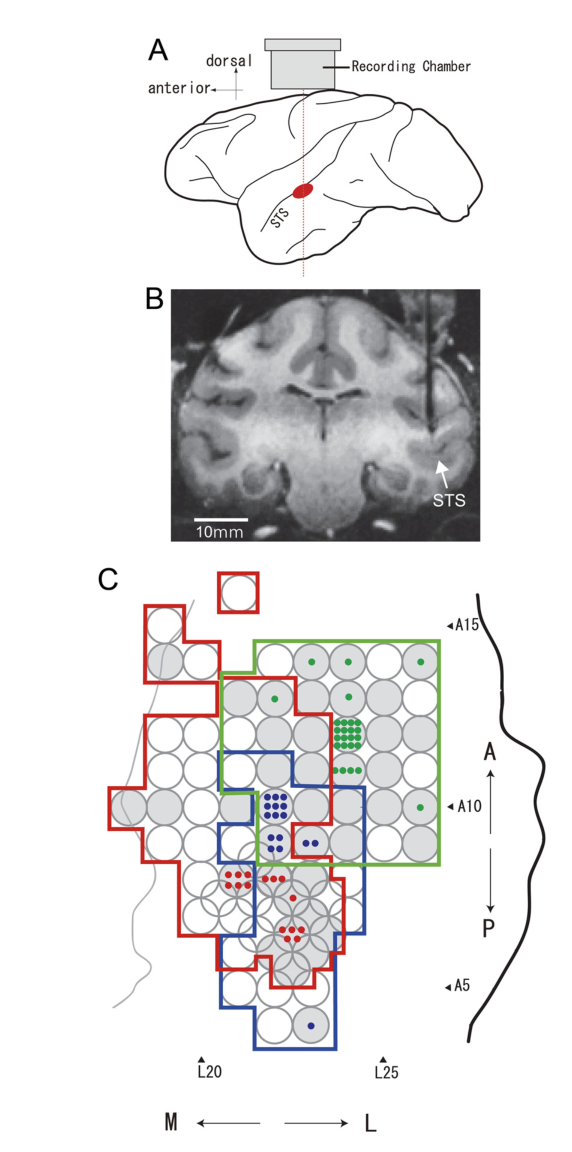
图 3 · 刺激示例:形状、打乱与照明
原文图注:Figure 3. Examples of stimuli. A, Examples of stimuli with 10 different shapes and 5 different surface reflectances rendered under default illumination (Eucalyptus Glove). B, Examples of shuffled stimuli (shape 3) with five different surface reflectances. C, Examples of stimuli (shape 3) with five different surface reflectances rendered under illumination 2 (Campus at Sunset).
解读:与图 1 配套的实例图。A 让读者直观看到"同一反射特性换形状、同一形状换反射特性"两个维度的正交变化——这正是换形状对照的逻辑前提:形状变了但光泽感没变。B 展示打乱后的刺激:像素统计几乎不变而高光结构瓦解,光泽感消失。C 展示第二种自然光照下的同一组表面。三组图共同支撑"光泽是可独立操纵、可独立保持的知觉属性"这一前提。
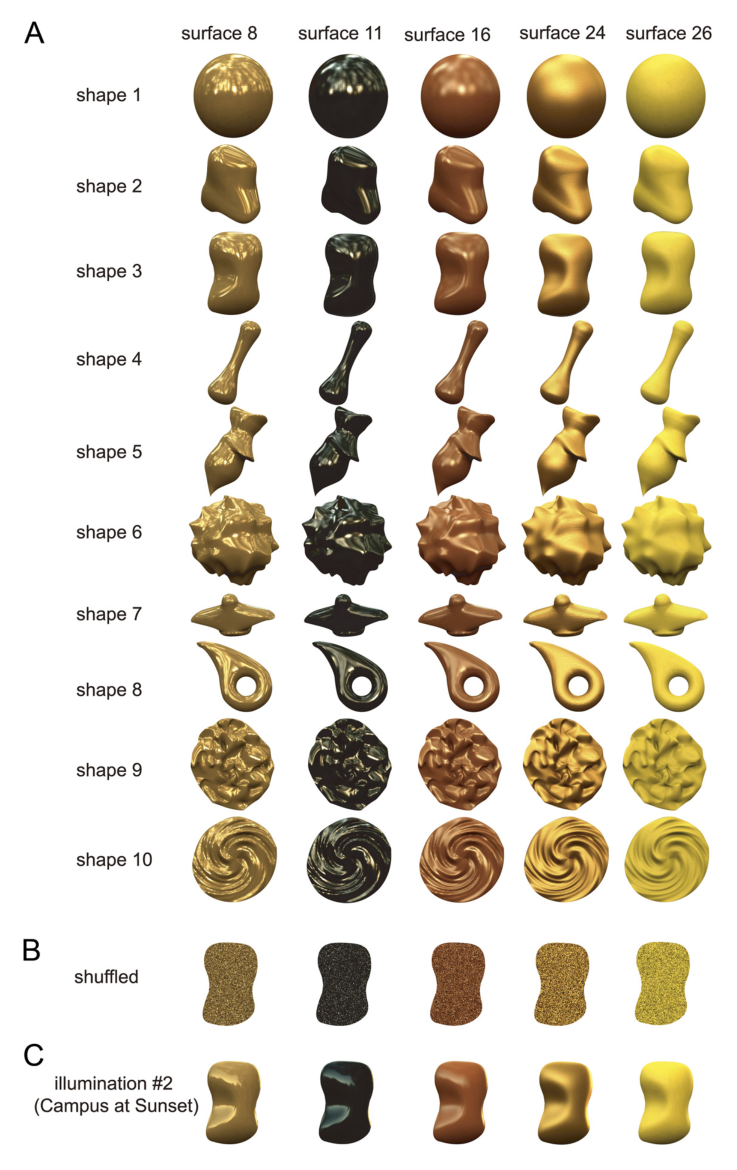
图 4 · 三个示例神经元:各有所好
原文图注:Figure 4. Responses to gloss stimulus set. A, Responses of an example neuron (cell 1) to the gloss stimulus set. The responses are depicted as raster plots and poststimulus time histograms (PSTHs). The horizontal bars under the PSTHs indicate the stimulus presentation period. B, Response magnitude of cell 1 to each stimulus in the gloss stimulus set represented by the size of the object image. This neuron strongly responded to stimuli with sharp highlights and did not respond to stimuli with weak glossiness. C, Response magnitude of cell 1 to each stimulus in the gloss stimulus set represented as the diameter of a circle and plotted at the corresponding position in the gloss stimulus space. D, E, Responses of another neuron (cell 2) ……. This neuron selectively responded to shiny objects with blurred highlights due to large specular reflectance and roughness. F, G, Responses of a third neuron (cell 3) ……. This neuron strongly responded to matte stimuli without clear highlights and to those with small specular reflectance and large roughness.
解读:全文最重要的一张"现象图"。每个神经元三联呈现:A 是栅格图与刺激后时间直方图(PSTH)(横轴时间、刺激期由横条标出),B 用物体图大小表示 33 种刺激的反应幅度,C 把同样的反应以圆的直径放进光泽刺激空间——C 的妙处在于能一眼看出偏好落在参数空间的哪个角落。cell 1 偏锐利高光(选择性指数 1.08、稀疏性 0.51,仅 6 个刺激超过半峰反应),cell 2 偏模糊高光(0.95/0.46,仅 3 个超半峰),cell 3 偏哑光(1.05/0.32,较宽调谐)。三个细胞偏好的参数区域不同,说明"光泽选择性"不是单一类型而是覆盖参数空间不同位置的神经元家族——这为图 13 的群体表征埋下伏笔。
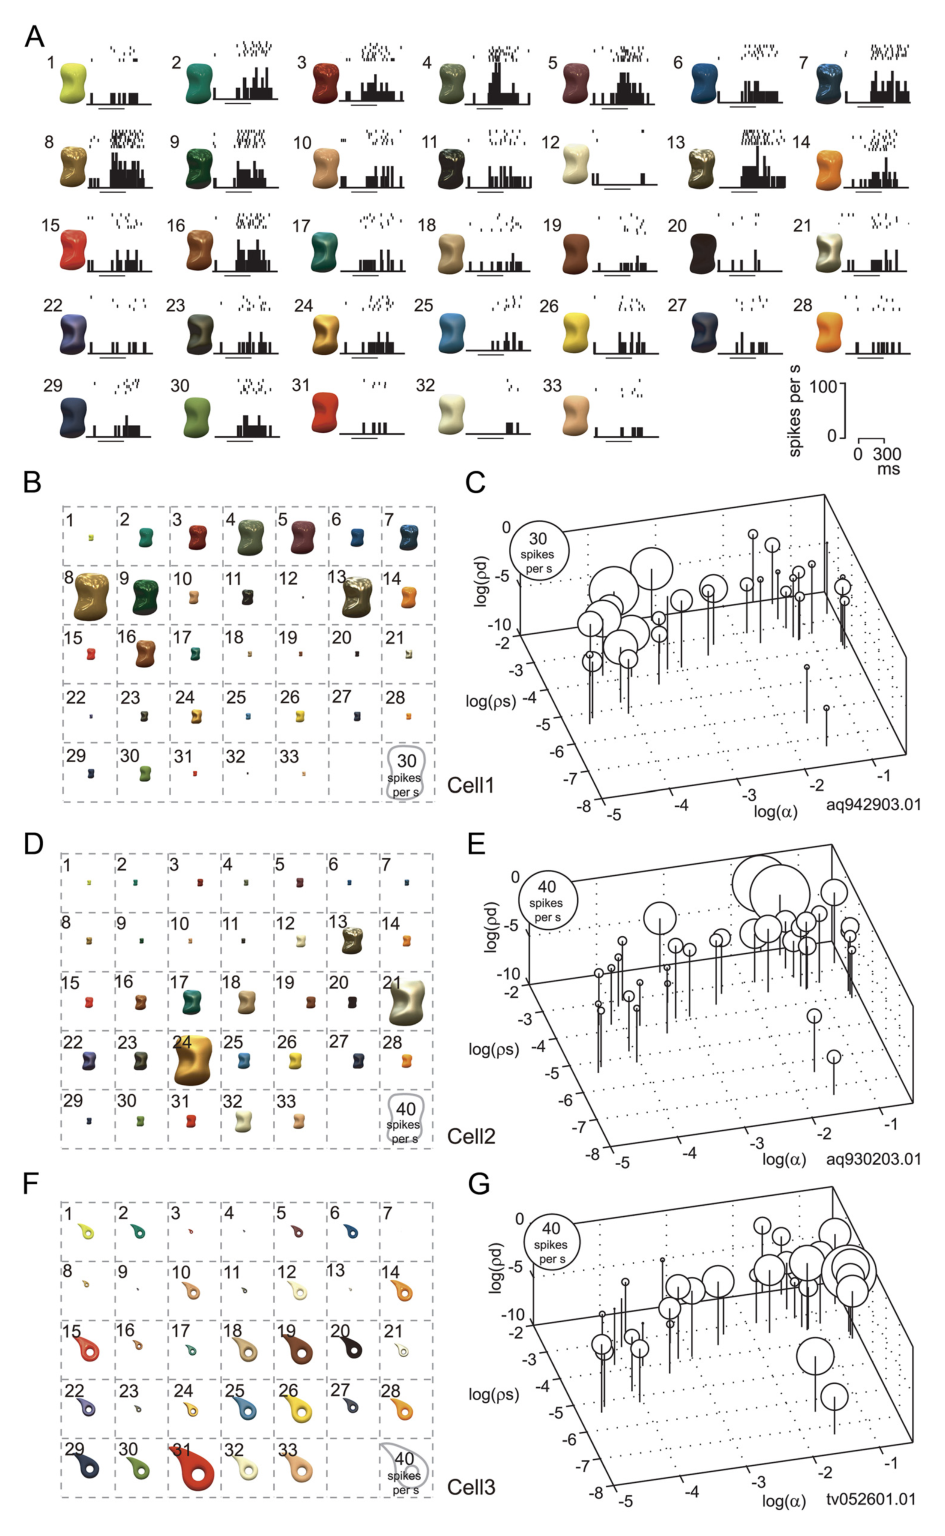
图 5 · 换形状与打乱像素:单细胞对照
原文图注:Figure 5. Effects of a change in object shape and pixel shuffling on the activity of the neurons depicted in Figure 4. A, Responses of cell 1 (the same neuron depicted in Fig. 4A–C) sorted according to the rank order of its response magnitude when the optimal shape was used. The horizontal axis indicates rank order for the optimal shape (shape 3); the vertical axis indicates response magnitude (with SEM). The red line depicts the responses to the optimal shape; the blue line, those to the nonoptimal shape (shape 2); and the black line, those to the shuffled stimuli. Object images with the optimal shape are shown at the top in rank order. The inset shows the relationship between the responses to each stimulus in the gloss stimulus set for the optimal (horizontal axis) and nonoptimal (vertical axis) shapes. B, C, Responses of cells 2 and 3 respectively, with the optimal and nonoptimal shapes 3/9 for cell 2 and 8/4 for cell 3.
解读:横轴按最优形状下反应排序(红),蓝线是同一排序下非最优形状的反应、黑线是打乱刺激的反应。cell 1 与 cell 2:蓝线沿横轴单调下降、与红线高度相关(r=0.86、0.82),黑线几乎贴零(cell 1 最大 1.71 spikes/s、cell 2 最大 6.84)——换形状保选择性、打乱毁反应,正是真光泽编码的预期模式。cell 3 则相反:换形状相关虽高(r=0.87),但对打乱刺激也强烈反应(最大 25.6 spikes/s,r=0.71)——它的"选择性"其实跟着平均亮度/颜色走,属于必须剔除的对照。三个细胞一正一反,把判别标准的道理演得清清楚楚。
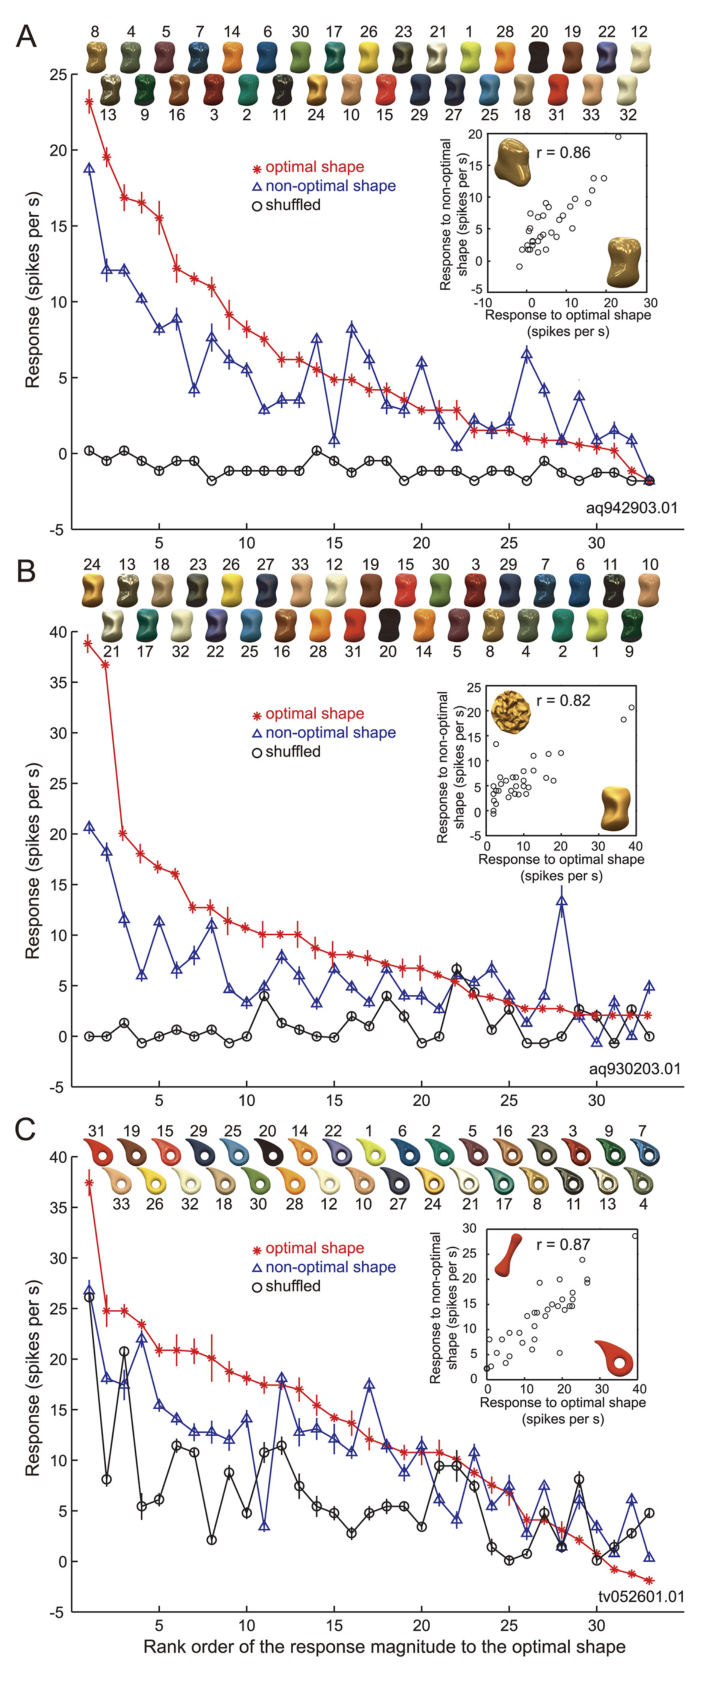
图 6 · gloss-selective 神经元的判定散点
原文图注:Figure 6. Effects of shape change and pixel shuffling: population analysis. In the scatter plot, horizontal axis indicates correlation coefficient between the responses to the optimal and nonoptimal shapes, and vertical axis that between the responses to the optimal shape and shuffled stimuli. If a neuron did not exhibit significant response to the nonoptimal shape or shuffled stimuli, they are plotted on the horizontal or vertical axis, respectively. We defined "gloss-selective" neurons using two criteria: (1) They should be responsive to a nonoptimal shape, and there should be significant correlation between the patterns of stimulus selectivity between the optimal and nonoptimal shapes (p≤0.05). And (2) they should not show significant response to shuffled stimuli ……. The red circles represent gloss-selective neurons that satisfied these two criteria. ……
解读:横轴是"换形状后选择性保得住吗"的相关系数,纵轴是"打乱后还残留多少选择性"的相关系数,右上角的点意味着两种情况都沾——既跨形状稳定又对像素统计敏感,即可能在编码亮度/颜色。红线圈出的 57 个点(对最优/非最优形状相关显著、对打乱无显著反应或模式不相关)就是正式判定的光泽选择性(gloss-selective)群体;蓝圈 43 个则是跨形状稳定但对打乱也显著相关的"疑似低层特征驱动"神经元。边上的直方图给出两个相关系数各自的分布。判定 gloss-selective 神经元的数量(57/139 双测试者)直接来自这张图的划线规则。
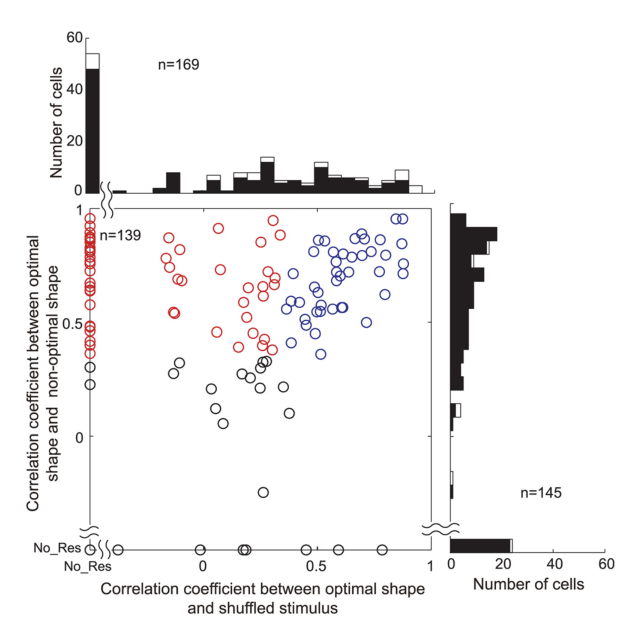
图 7 · 形状可分离性指数
原文图注:Figure 7. Separability index for a change in shape. A, Distribution of the separability index for a change in object shape. The horizontal axis indicates the separability index, the vertical axis the number of cells. B, Distribution of r² between the actual and predicted responses computed from only the second principal component. The filled and open bars indicate significant and nonsignificant cells, respectively, based on the permutation test. C, Raw interaction plot connecting the responses to the gloss stimulus set for the optimal shape (left) and the nonoptimal shape (right) for four representative example neurons. The left two panels are for cell 1 and cell 2 depicted in Figures 4 and 5. Separability index for each neuron is 0.92, 0.93, 0.96, and 0.98, respectively.
解读:A 的直方图显示 57 个光泽选择性神经元全部具有显著的可分离性指数(均值 0.86±0.08,多数 ≥0.7)——即"光泽 × 形状"反应矩阵几乎可以分解成两个独立因子,光泽调谐曲线换形状时基本只是整体缩放。B 检查第二主成分的贡献:仅 1 个神经元显著,说明交互项(光泽偏好随形状漂移的成分)可以忽略。C 的交互折线图给出 4 个代表性细胞的原始曲线,右侧(非最优形状)与左侧(最优形状)的折线几乎平行。这张图把图 6 的相关判据换成了更严格的矩阵分解语言,结论一致:光泽选择性对形状不变。
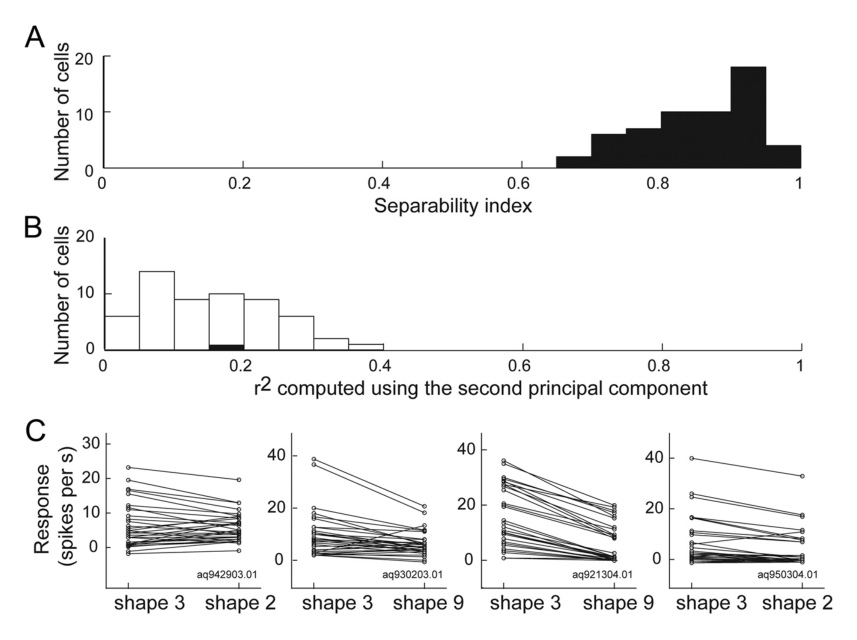
图 8 · 选择性与稀疏性分布
原文图注:Figure 8. Distribution of the selectivity and sparseness indices among gloss-selective neurons. A, Distribution of the selectivity indices of 57 gloss-selective neurons. The horizontal axis indicates the selectivity index, and the height of each bar indicates the number of cells (left vertical axis). The rightmost bar indicates cells with a selectivity index over 1.2. The black line indicates the cumulative percentage of indices (right vertical axis). B, Distribution of the sparseness indices of the 57 gloss-selective neurons. Other conventions are the same as in A.
解读:左图是选择性指数(1 − 最小/最大反应,可超过 1 因为弱刺激反应可低于基线)的分布:中位数 1.02,累积曲线显示多数细胞指数 ≥0.6,说明这些神经元对光泽刺激集的调谐相当尖锐;右图是稀疏性指数(反应在 33 个刺激上分布的不均匀程度)分布:中位数 0.43、多数 ≥0.3,意味着只有少数刺激能驱动强反应。正文还用这张图的样本补了一个对照——最优与非最优形状下的选择性指数无差异(1.03±0.18 vs 1.02±0.18)——即换形状不但保住偏好模式,连选择强度都不打折。
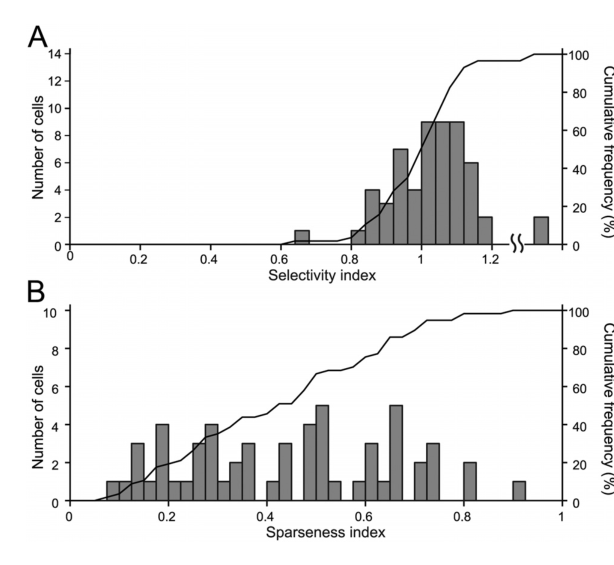
图 9 · 群体平均的排序曲线
原文图注:Figure 9. Rank order of the responses to the gloss stimulus set: population average. A, Average of the responses of 57 gloss-selective neurons (Fig. 6, red circles) to stimuli with the optimal shape (red line), a nonoptimal shape (blue line), and shuffled stimuli (black line), sorted according to the rank order of the responses to the optimal shape for each neuron. B, Average of the responses of 43 neurons that showed significant correlation between the responses to the optimal shape and shuffled stimuli (Fig. 6, blue circles). Other conventions are the same as in A.
解读:把每个细胞的最优形状反应从高到低排序后取群体平均。A 中红线是基线参照;蓝线(非最优形状)单调下降、只是斜率更缓——偏好顺序在群体层面被换形状保留;黑线(打乱)近乎水平(拟合斜率 −0.07 spikes/s/rank 虽统计非零但极小,且对打乱有反应的 27 个神经元中仅 2 个斜率显著),说明像素统计对群体选择性的贡献微乎其微。B 是对照组(43 个蓝圈神经元):蓝线与黑线同样单调下降——这些细胞的"选择性"在打乱后原样保留,恰是它们由平均亮度/颜色驱动的群体证据。A 与 B 互为镜像,是全文最干净的一张群体验证图。
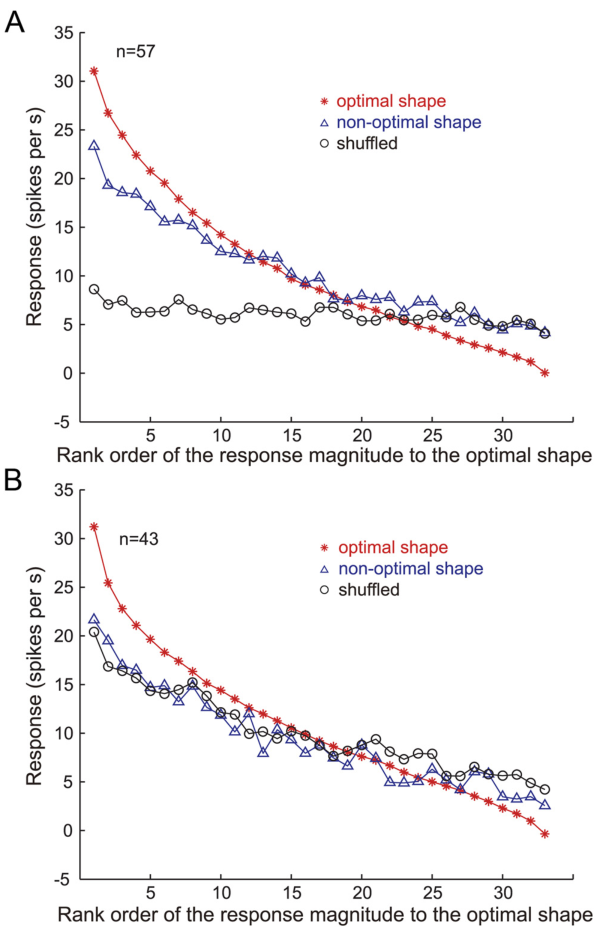
图 10 · 偏好刺激的分布
原文图注:Figure 10. Stimulus preference of gloss-selective neurons. A, C, Responses of a gloss-selective neuron that was selectively responsive to shiny objects with clear highlights (cell 4). B, D, Responses of another gloss-selective neuron that was selectively responsive to matte objects (cell 5). These are examples of gloss-selective neurons recorded from monkey TV, while those shown in Figure 4 (cell 1 and cell 2) are from monkey AQ. Conventions are the same as in Figure 4, B and C. E, Population average of the normalized responses of 57 gloss-selective neurons to each stimulus in the gloss stimulus set. F, The numbers of gloss-selective neurons that showed a peak response to each stimulus in the gloss stimulus set.
解读:A–D 补充两只动物、两类极端偏好(锐利高光偏好 vs 哑光偏好)的例子,说明细胞间偏好差异不是单只动物的偶然。E 是 57 个神经元对 33 种刺激的归一化群体平均:最大 0.47(刺激 13)对最小 0.21(刺激 33),比值 2.18,且呈"越亮越强反应"的趋势——群体对整个刺激集都有覆盖,不是只对少数光泽放电。F 统计每个刺激作为峰值刺激的神经元数目:峰值多落在高 ρs、低粗糙度区,小 ρs 刺激较少——这就是"编码空间有偏"的直接证据,也预告了图 13 MDS 平面的不对称布局。
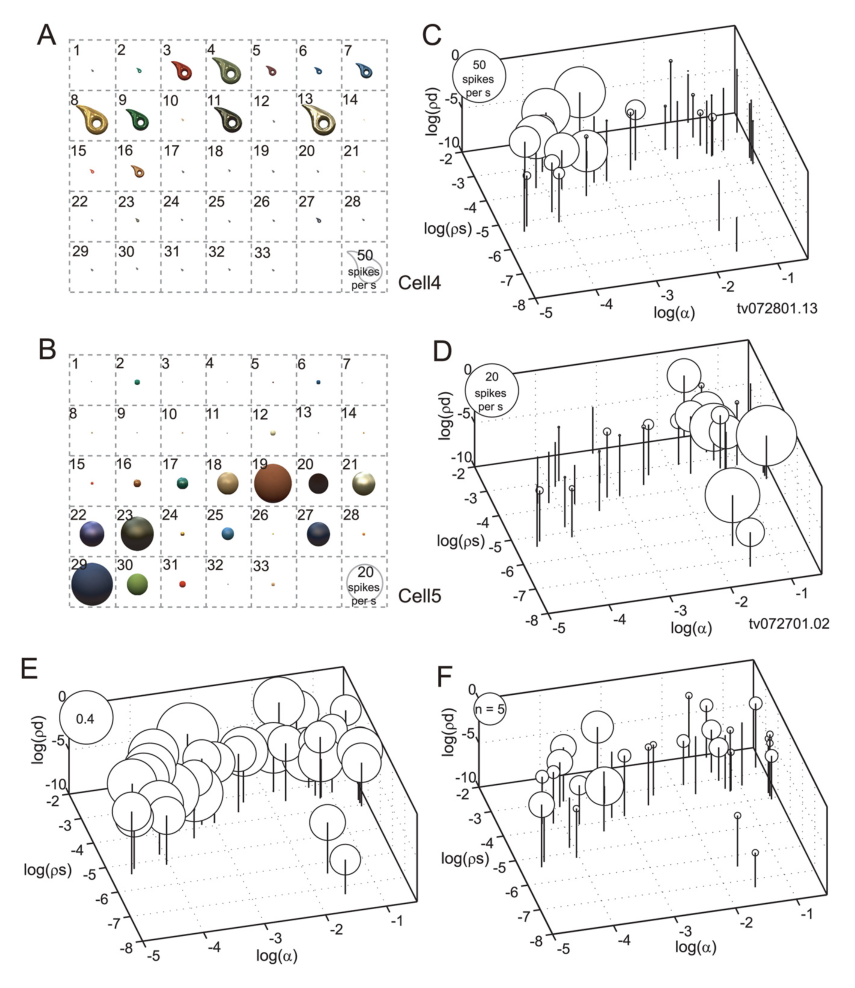
图 11 · 照明改变:单细胞与群体汇总
原文图注:Figure 11. Effects of illumination change. A, Responses of cell 1 (the neuron depicted in Fig. 4A–C) sorted according to the rank order of the response magnitudes under the default illumination (illumination 1, Eucalyptus Grove). The horizontal axis indicates the rank order of the responses, and the vertical axis indicates the response magnitude (with SEM). The red line depicts the responses under illumination 1; the blue line depicts those under different illumination (illumination 2, Campus at Sunset). ……. The inset shows the relationship between the responses to each stimulus in the gloss stimulus set under illuminations 1 (horizontal axis) and 2 (vertical axis). B, Summary of the effects of the illumination and shape in 48 gloss-selective neurons tested under both illuminations. ……
解读:与图 5 同构的分析,只是把"换形状"换成"换照明"。A 中蓝线(Campus at Sunset 照明)沿红线(默认照明)的排序单调下降,两种照明下的反应相关达 r=0.81——高光图案因光源改变而整体挪位,偏好顺序却没变。B 的散点把照明相关(横轴)与形状相关(纵轴)并排:48 个受测神经元中 40 个(83.3%)跨照明显著相关,而按定义全部都跨形状显著相关。这组对照的逻辑前提(在自然光照范围内换照明对光泽知觉影响不大)来自心理物理学(Fleming 等 2003),神经元的不变性与之吻合。
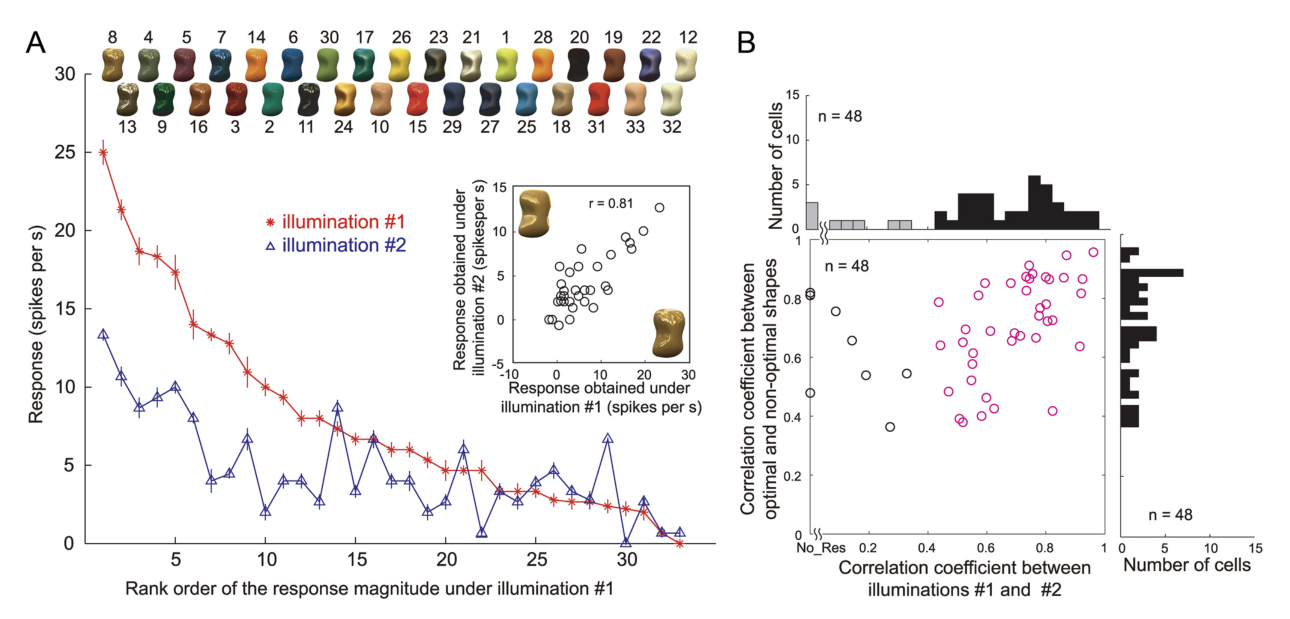
图 12 · 照明可分离性
原文图注:Figure 12. Effect of illumination on responses among gloss-selective neurons. A, Distribution of separability indices for the change in illumination. The filled and open bars indicate significant and nonsignificant cells, respectively, based on the permutation test. B, Distribution of r² between the actual and predicted responses computed from only the second principal component. C, Average of the responses of 57 gloss-selective neurons to stimuli with the optimal shape rendered under default illumination (illumination 1, Eucalyptus Grove; redline) and another illumination (illumination 2, Campus at Sunset; blueline) sorted according to the rank order of the responses under illumination 1.
解读:这是图 7 的照明版:A 显示除 1 个外全部显著(均值 0.84±0.1,多数 ≥0.7),B 显示仅 2 个神经元的第二主成分显著——照明×光泽的交互同样可以忽略。C 的群体平均里蓝线(照明 2)沿红线(照明 1)排序平滑下降,且照明 2 下的选择性指数(1.08±0.20)甚至略高于照明 1(1.04±0.19,p=0.032,勉强显著)。结论与形状不变性平行:光泽选择性对照明变化也基本不变,作者由此认为这些神经元编码的是"表面反射特性"本身,而非随光源/视角漂移的明暗图案。
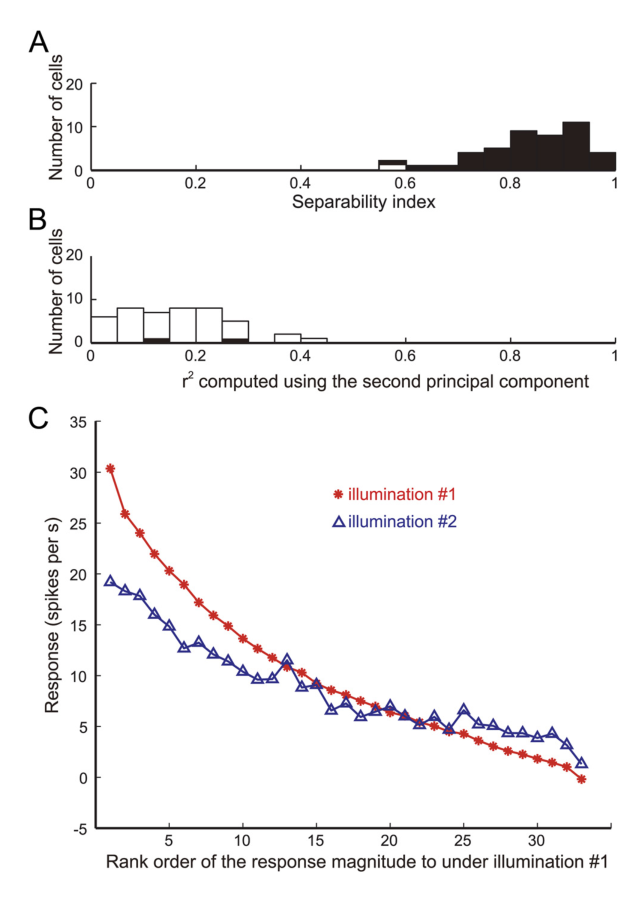
图 13 · 群体表征的 MDS 平面
原文图注:Figure 13. Neural representation of gloss in the activities of gloss-selective neurons. A, Relationship between the responses of 57 gloss-selective neurons to a pair of stimuli (surfaces 3 and 8) that are similarly glossy in appearance. The horizontal axis indicates responses to one stimulus (no. 3); the vertical axis indicates the responses to the other (no. 8). B, Relationship between the responses of 57 gloss-selective neurons to a pair of stimuli (surfaces 3 and 31) that differ with respect to their glossiness. Conventions are as in A. C, Two-dimensional plot of the results of MDS analysis. Distances were based on 1 − r between the responses of the 57 gloss-selective neurons for each stimulus pair from the gloss stimulus set. The inset is a scree plot showing the relationship between the number of dimensions and the stress in the MDS analysis.
解读:A、B 是两个示范刺激对:3 与 8 颜色明暗迥异但同样高光泽,57 个神经元的反应向量几乎共线(r=0.92,神经距离小);3 与 31 一个高光泽一个哑光,反应模式几乎无关(r=0.22,神经距离大)——群体"看见"的是光泽而不是像素统计。C 把全部 33 种刺激按 1−r 距离排进二维平面(scree 图表明二维已足够,stress 0.12):高镜面刺激聚左侧、模糊高光聚右下、哑光聚右上,光泽在平面内连续渐变,且与 Ferwerda 等 2001 年知觉光泽空间的两轴(contrast gloss、distinctness of image reflections)系统性对应。这是"群体系统性表征光泽"结论的最终落点。
讨论
作者的解读分几层。首先,这批神经元的跨形状、跨照明不变性与像素打乱敏感性结合在一起,说明它们编码的是与"表面反射特性"绑定的特征,而不是局部亮度图案或低层统计( luminance contrast 与反应的分析也大多不显著);由于明暗与高光的位置会随光源和视角移动,而立体/纹理线索固定在表面位置上,作者推断 STS 下岸可能并存两套机制——一套用立体与纹理编码三维形状(Janssen 等报告的区域更靠前),另一套用明暗与高光编码表面反射,本研究的记录位点也与颜色选择性集中区不同。其次,与先前材质研究相比,CUReT 材质自带的宏观表面纹理会混入复杂明暗模式,而 MERL BRDF 刺激没有中尺度结构,得以把"反射特性选择性"单独分离出来——这是方法论上的关键差异。第三,MDS 平面与知觉光泽空间的两轴对应,暗示神经活动与光泽知觉密切关联;但作者坦承光泽知觉依赖哪些图像特征(高光之外还有图像统计假说)尚不清楚,这些神经元如何从早期视觉区的加工中生成选择性是留给未来的问题。分类上也保持审慎:gloss-selective 神经元与其他神经元构成连续分布,蓝圈神经元可能也在编码低光泽端(如 cell 3 那样偏好低镜面反射的刺激可能被保守标准漏掉了)。最后,作者把这一发现放进物体识别的大图景——食物新鲜度、皮肤状态都写在表面反射上——主张 IT 皮层确实参与光泽信息的加工。
一句话总结
我认为这篇文章的精妙之处在于一对互为镜像的对照:换形状保光泽、打乱像素保统计——两个操作把"光泽"从图像里干净地拎了出来,剩下的那部分神经元反应就只能用光泽解释。加上 MDS 平面与知觉光泽空间的对应,单细胞数据第一次给出了材质维度的群体编码图。如果说有保留,那就是 57 个"严格合格"的神经元样本背后还有一大片灰色地带(蓝圈神经元),光泽编码的边界可能比保守判据画出来的更宽。
审校与证据追溯 (Verification & Evidence)
图表审计结果
- Fig1: 提取质量
good,对齐度full,识别面板[A, B, C, D] - Fig10: 提取质量
good,对齐度full,识别面板[A, B, C, D, E, F] - Fig11: 提取质量
good,对齐度full,识别面板[A, B, C] - Fig12: 提取质量
good,对齐度full,识别面板[A, B, C] - Fig13: 提取质量
good,对齐度full,识别面板[A, B, C] - Fig2: 提取质量
good,对齐度full,识别面板[A, B, C] - Fig3: 提取质量
good,对齐度full,识别面板[A, B, C] - Fig4: 提取质量
good,对齐度full,识别面板[A, B, C, D, E] - Fig5: 提取质量
good,对齐度full,识别面板[A, C] - Fig6: 提取质量
good,对齐度full,识别面板[] - Fig7: 提取质量
good,对齐度full,识别面板[A, B, C] - Fig8: 提取质量
good,对齐度full,识别面板[A, B] - Fig9: 提取质量
good,对齐度full,识别面板[A, B]
关键事实与局限性声明
- 审校纠偏: “证明选择性依赖光泽知觉本身”超出了被动注视单细胞数据能够支持的范围。
- 审校纠偏: “反应只能用光泽解释”错误排除了尚未检验的复合图像特征解释。
- 审校纠偏: “群体看见的是光泽而不是像素统计”把相关性和控制实验结果拟人化并因果化。
- 审校纠偏: “与知觉光泽空间两轴系统对应”应降格为定性相似或可能相关。
- 审校纠偏: “跨形状、跨照明不变”应限定为在所测试条件下大体保持。
- 审校纠偏: “单细胞数据第一次给出材质维度的群体编码图”属于未经本文直接建立的优先权声明。
- 补充要点: 应明确说明没有取得动物自身的光泽知觉判断,因此神经活动与知觉之间的关系属于间接推论。
- 补充要点: 应明确交代控制实验覆盖范围:194个选择性神经元中145个测试了多于一种形状、169个测试了打乱刺激,只有139个完成双对照;57个gloss-selective神经元是139个中的操作性子集。
- 补充要点: 应补充跨照明的负结果:48个受测神经元中8个没有显著跨照明相关。
- 补充要点: 应补充形状控制并非完全无交互:代表性cell 1存在显著形状×表面反射交互,只是整体调谐模式仍高度相关。
- 补充要点: 应说明记录区域在初步映射后针对光泽响应较常见的位置进行密集采样,因此57/215不能直接解释为整个IT皮层中光泽选择性神经元的无偏比例。