该研究使用同一组 92 张物体图像,在同一批被试中采集脑磁图(MEG)与功能磁共振(fMRI)数据,并利用表征相似性分析(RSA)将两类信号映射至统一表征空间进行对齐。研究结合了 MEG 的毫秒级时间分辨率与 fMRI 的空间定位能力,分析了从图像识别到不同类别层级的解码时程,区分了瞬态与持续神经活动,并将信号来源与 V1 和 IT 区域相对应,进而对比了人类 MEG 与猕猴 IT 单细胞记录的表征结构。
研究背景
人类物体识别依赖枕叶与颞叶的皮层层级结构,并在毫秒尺度内快速演变。MEG/EEG 具备高时间分辨率,但皮层空间源定位存在不确定性;fMRI 能提供精细的解剖定位,但受限于血氧动力学响应的时间平滑效应。以往 ERP 研究常通过 M100、N170 等波幅成分划分加工阶段,而 fMRI 研究多聚焦于面孔、身体等特异性皮层区域,两类测量体系缺少直接对应的对齐方式。此外,灵长类单细胞电生理数据在时间与空间尺度上均不同于无创脑成像,也缺乏统一的比较桥梁。
表征相似性分析(RSA)为跨模态整合提供了工具:通过在各模态内部计算两两刺激间的几何距离构建表征不相似性矩阵(RDM),可在抽象的表征相似性空间中跨越测量尺度。逐时间点提取 MEG 解码矩阵,并与 fMRI 在 V1 及 IT 提取的 RDM 进行相关分析,可检验不同时段 MEG 模式偏向哪一皮层区域的表征结构;同一套 92 张图像刺激亦支持与猕猴 IT 电生理数据进行跨物种对比。此外,时间-时间泛化分类有助于区分短暂变化的瞬态表征与时间跨度更长的持续表征。
本研究在相同刺激与被试条件下同步整合 MEG 与 fMRI,对比个体图像与各类别水平的解码时序,并检验其与 V1、IT 及猕猴 IT 数据的对应关系。
研究思路
研究设计包含四个分析步骤:第一,在各时间点对 MEG 多通道信号进行多变量模式分类(MVPA),记录图像与不同类别层级(上位、中位、下位)被区分的时间进程。第二,逐时间点将 MEG 解码矩阵与 fMRI 提取的 V1 和 IT 差异矩阵进行 Spearman 秩相关分析,推断特定时间窗口内主导全脑表征结构的皮层区域。
第三,构建时间-时间泛化矩阵(以某时刻训练的分类器测试其他所有时刻的响应模式),分离瞬态响应与持续维持的神经表征;随后再次通过 RSA 将持续活动成分与 V1 和 IT 的表征结构相匹配,分析其皮层解剖来源。第四,将人类 MEG 各时间点的解码矩阵与猕猴 IT 神经元群体的 RDM 进行对齐,检验两物种间表征空间的一致性。
方法
实验纳入 16 名右利手健康被试(10 名女性,平均年龄 25.87±5.38 岁),其中 15 人完成两次 MEG 与两次 fMRI 扫描,1 人仅完成 MEG。刺激由 92 张自然物体图像构成(涵盖人/非人面孔、身体及自然/人造物体),中央呈现,视角约 2.9°,呈现时长 500 ms,刺激间隔 1.5–2 s;实验穿插回形针按键检测任务以维持注意(平均每 4 试次出现一次,该试次不计入分析)。MEG 采用 306 通道设备采集,采样率 1 kHz,提取刺激前 100 ms 至刺激后 1200 ms 的信号。fMRI 扫描在 3T 磁共振上进行,采用 2 mm 各向同性体素 EPI 序列,覆盖枕颞皮层,通过一般线性模型(GLM)估计各图像的响应幅值 t 值。
分析流程包括:MEG 信号在逐时间点构成模式向量,使用线性支持向量机(SVM)进行两两分类(采用留一交叉验证并随机打乱重复 100 次),分类准确率填入 92×92 解码矩阵。fMRI 数据定义三个感兴趣区(ROI):中心视野 V1(0–3° 视角)、外周视野 V1(3–6°,用作无刺激对照)以及 IT(包含梭状回与下颞皮层,选取激活最强的 361 个体素以匹配中心 V1 尺寸);提取 ROI 内体素响应模式并计算两两 Pearson 相关系数,以 1−R 构成 92×92 fMRI 不相似性矩阵。RSA 分析通过计算逐点 MEG 解码矩阵与 fMRI 矩阵间的 Spearman 相关进行检验;统计推断采用符号置换检验结合簇校正(50000 次置换),峰值与起始时延的置信区间通过 bootstrap 重采样获得;二维可视化使用多维标度分析(MDS)。
主要结果
- 单张图像在刺激后约 50 ms 即可被解码:全图集平均解码在 48 ms(45–51 ms)达到统计显著,峰值出现在 102 ms(98–107 ms);图集六个子集各自的解码在 51–61 ms 显著,峰值出现在 99–112 ms(图 1)。
- 类别层级解码峰值晚于单张图像:有生性(animacy)峰值出现在 157 ms(152–302 ms),自然/人造物体峰值在 122 ms(107–254 ms),面孔对身体峰值在 136 ms(131–140 ms),人对非人身体峰值在 170 ms(104–252 ms),人对非人面孔呈现双峰(127 ms 与 190 ms)(图 2)。Bootstrap 检验显示单张图像的解码峰值早于各类别层级(除人对非人身体外均 P < 0.001);解码峰值准确率与行为分类任务的反应时呈正相关(R = 0.53, P = 0.003),与错误率呈负相关(R = −0.49, P = 0.012)。同时,各类别维度的显著起始时间多介于 48–70 ms 之间(自然/人造为 93 ms)。
- 神经活动呈现瞬态与持续双重特征:时间-时间泛化矩阵表现出沿对角线分布的窄带峰值(分类器仅在相邻时间点具备泛化能力,对应瞬态活动);同时检测到两处偏离对角线的持续模式:在约 100 ms 处训练的表征能够泛化至 200–1000 ms 时段,以及在 250–500 ms 处出现对角线明显加宽的现象(图 3)。
- 早期 MEG 模式偏向 V1,晚期偏向 IT:MEG 与 V1 不相似性矩阵的相关峰值出现在 101 ms(84–109 ms),与 IT 的相关峰值出现在 132 ms(129–290 ms),两峰值时延差异具有统计学意义(P = 0.016);差值曲线显示早期(约 93 ms 峰值)与 V1 的相关性更强,晚期(约 284 ms 峰值)与 IT 的相关性更强(图 4)。外周 V1 对照区未表现出类似的相关性。
- 持续活动的来源可分别对应至 V1 与 IT:逐对时间点 (tx,ty) 的 MEG 泛化矩阵与 fMRI 矩阵相关分析表明:约 100 ms 与 200–1000 ms 组合的持续活动主要与 V1 的表征结构相关,而 250–500 ms 期间的持续表征主要与 IT 结构相关(图 5)。
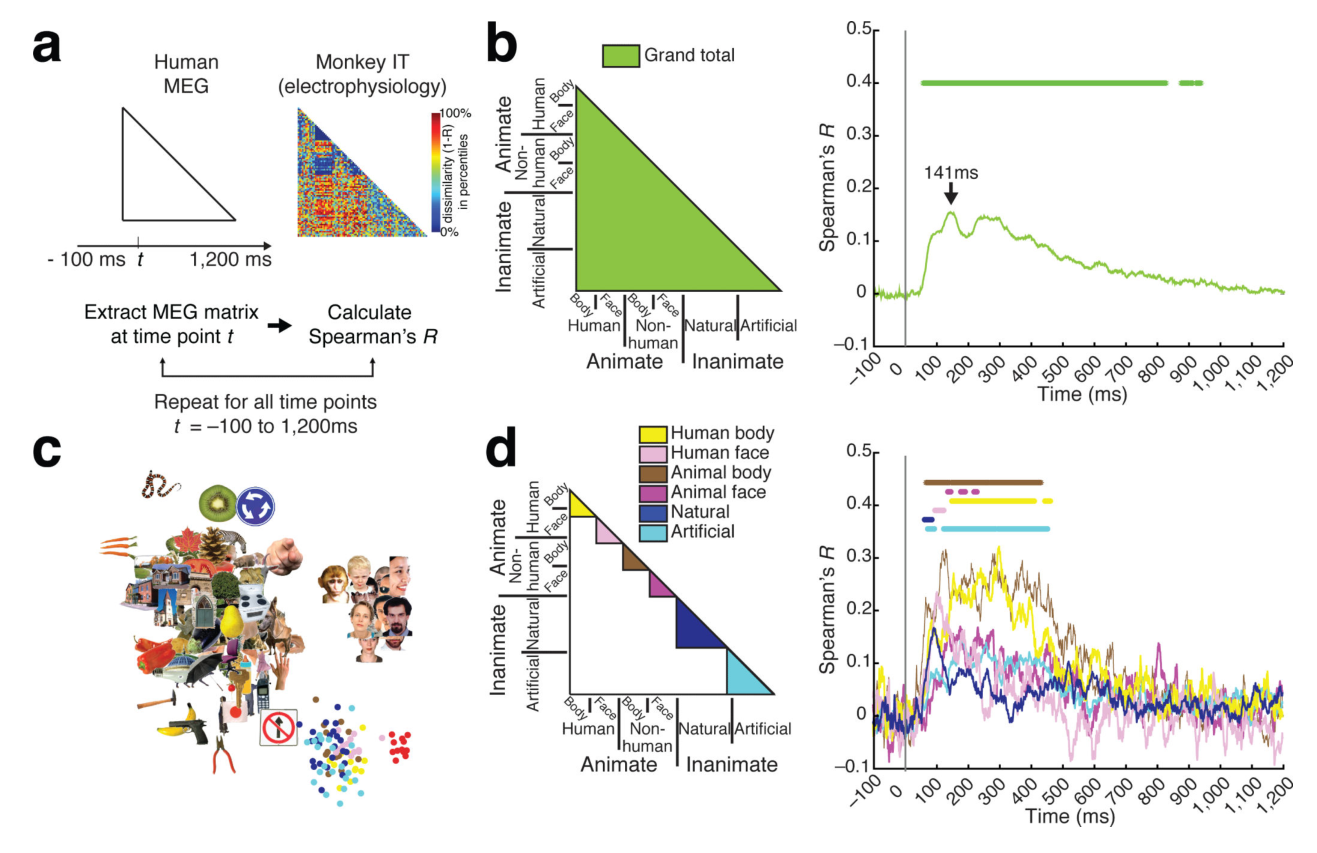
- 人类 MEG 与猕猴 IT 单细胞数据表征一致:与 Kiani 等(2007)在相同 92 张图像上记录的 674 个猕猴 IT 神经元 RDM 进行对比,人类 MEG 解码矩阵与猕猴 IT 矩阵的相关在约 66 ms(56–71 ms)开始达到显著(图注中报告的起始点为 54 ms,52–64 ms),峰值出现在 141 ms(132–292 ms);MDS 分析显示峰值时刻的共有表征以面孔维度为主导,且在各类细分子集内部均保持正相关(图 6)。
图注解读
图 1 · 从 MEG 信号解码单张图像
原文图注:Figure 1. Decoding of images from MEG signals (a) Image set of 92 images of different categories of objects. (b) Multivariate analysis of MEG data. (c) Examples of 92 × 92 MEG decoding matrices (averaged over participants, n=16). (d) Time course of grand total decoding. was significant at 48ms (45–51ms), with a peak at 102ms (98–107ms; horizontal error bar above peak shows 95% confidence interval). (e) Time course of object decoding within subdivisions. The left panel illustrates the separately averaged sections of the MEG decoding matrix (color-coded), the right panel the corresponding decoding time courses. Peak-latencies and onsets of significance are listed in Supplementary Table 1b. Stars indicate significant time points (n=16, cluster-defining threshold p<0.001, corrected significance level p<0.05). The gray vertical line indicates onset of image presentation.
(a) 展示 92 张物体图像数据集;(b) 说明逐时间点 SVM 两两模式分类流程;(c) 展示特定时点的 92×92 平均解码矩阵,非对角线亮度代表图像对的可区分度;(d) 总体平均解码正确率时间曲线,星号标注显著时间段;(e) 将矩阵分为六类子集(人/非人面孔与身体、自然/人造物体)分别计算的解码时程。结果表明单张图像表征在刺激呈现后约 48 ms 即可从 MEG 信号中检出,约 100 ms 达到峰值。
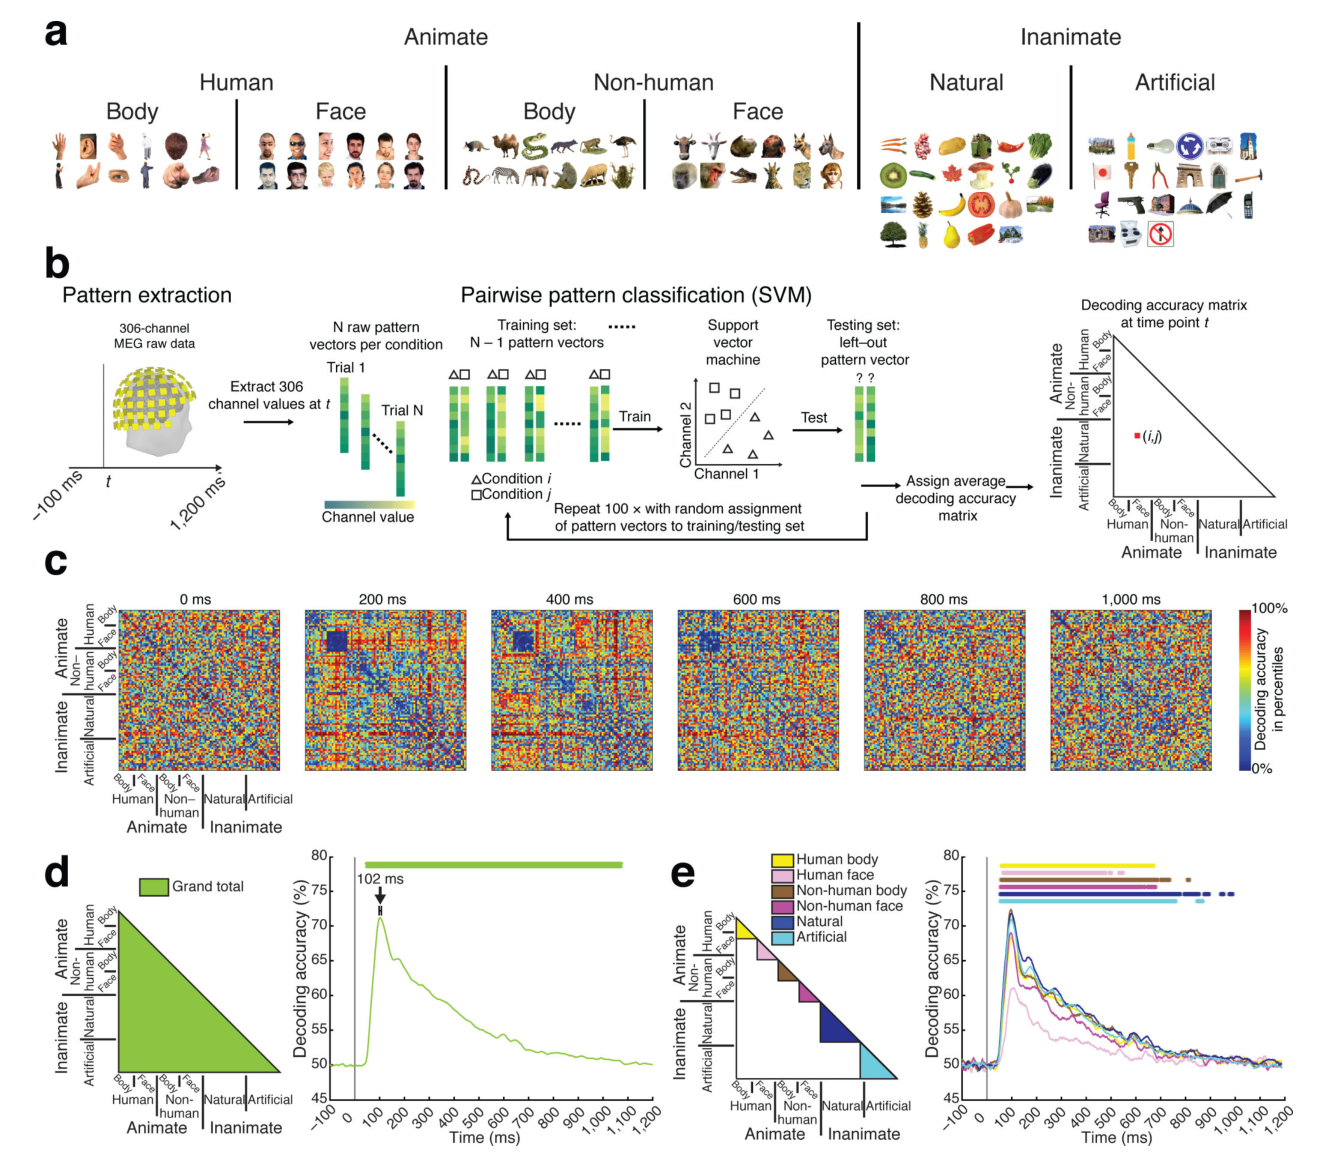
图 2 · 三个类别层级的解码时间进程
原文图注:Figure 2. Time course of decoding category membership of individual objects. We decoded object category membership for, (a) animacy, (b) naturalness, (c) faces versus bodies, (d) human bodies versus non-human bodies and (e) human versus non-human faces. The difference of within-subdivision (dark gray, left panel) minus between-subdivision (light gray, left panel) Peaks in decoding accuracy differences indicate time points at which the ratio of dissimilarity within a subdivision to dissimilarity across subdivision is smallest. n=16, stars, vertical gray line, and error bars same as in Figure 1. Statistical details are in Supplementary……
每个分类维度(a 有生性、b 自然属性、c 面孔/身体、d 身体物种、e 面孔物种)包含两项分析:左侧将解码矩阵分为类内与类间两组,右侧展示二者准确率差值的时间进程;差值达到峰值对应类内距离相对于类间距离最小的时间点,反映类别特征的显性表征;右端附带 MDS 二维投影。结果显示个体图像的解码峰值先于类别层级出现,较精细的类别区分(如物种)峰值时延相对滞后。
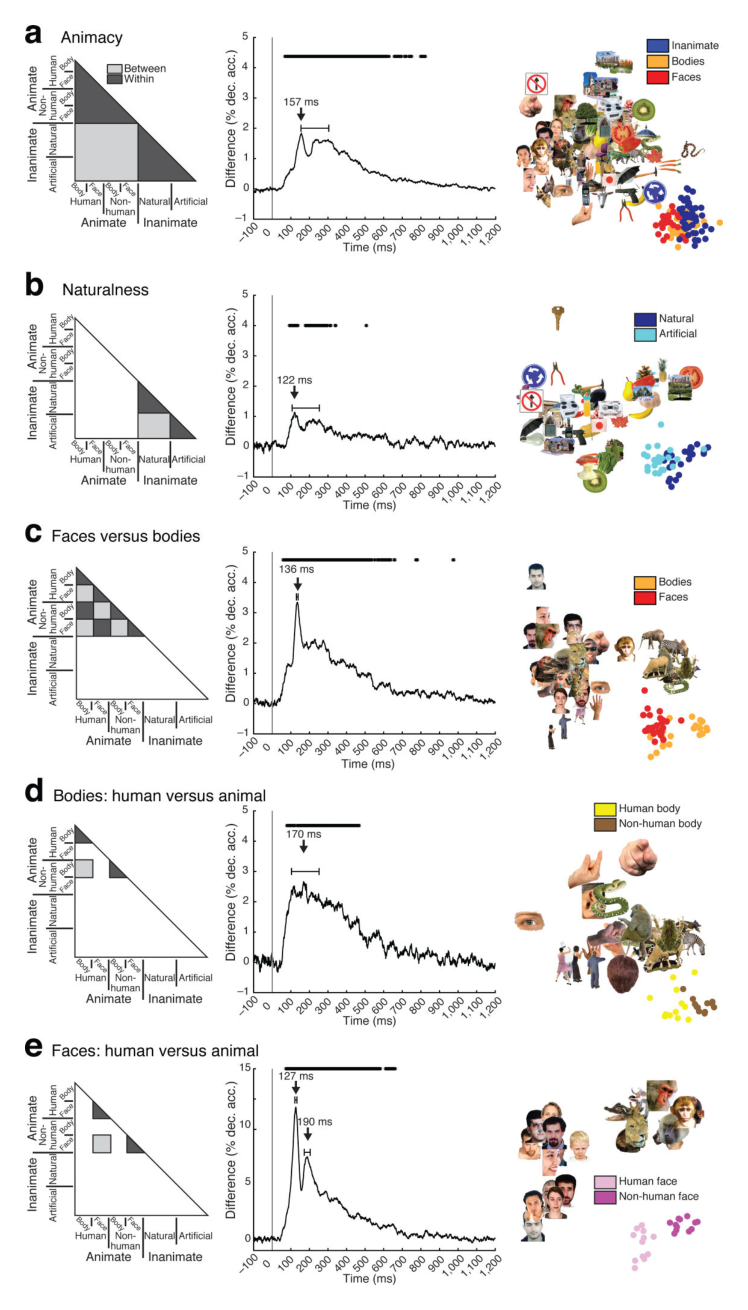
图 3 · 时间-时间泛化矩阵
原文图注:Figure 3. Dynamics of visual representations across time. (a) MEG brain responses were extracted for time points tx and ty after stimulus onset. SVM was trained to distinguish between images by visual representations at time point tx, and tested on brain responses to the same images at a different time point ty. We conducted all object classifications and averaged the overall decoding accuracy. Last, the averaged decoding accuracy was stored in the element (tx,ty) of a time-time MEG decoding matrix. The process was repeated for all pairs of time points. (b,c) Time-time decoding matrix averaged across participants. The gray lines indicate onset of image presentation. The white dotted rectangle indicates classifier generalization for the time-point combination ~100ms and 200-1,000ms, the dotted ellipse indicates classifier generalization by the broadened diagonal. (d) Significance was assessed by sign-permutation tests (n=16, cluster-defining threshold p<0.0001, corrected significance level p<0.05). Dark red indicates elements within the significant cluster.
矩阵横纵轴均为刺激后时间,元素 (tx,ty) 表示在 tx 训练的模型在 ty 测试时的解码正确率。(b,c) 中对角线高响应带对应快速演变的瞬态神经活动;白色虚线框标示 100 ms 表征向 200–1000 ms 时段泛化的非对角块,白色虚线椭圆标示 250–500 ms 间对角线加宽区域,均反映跨时间的持续维持活动。(d) 展示通过符号置换检验确定的显著簇。
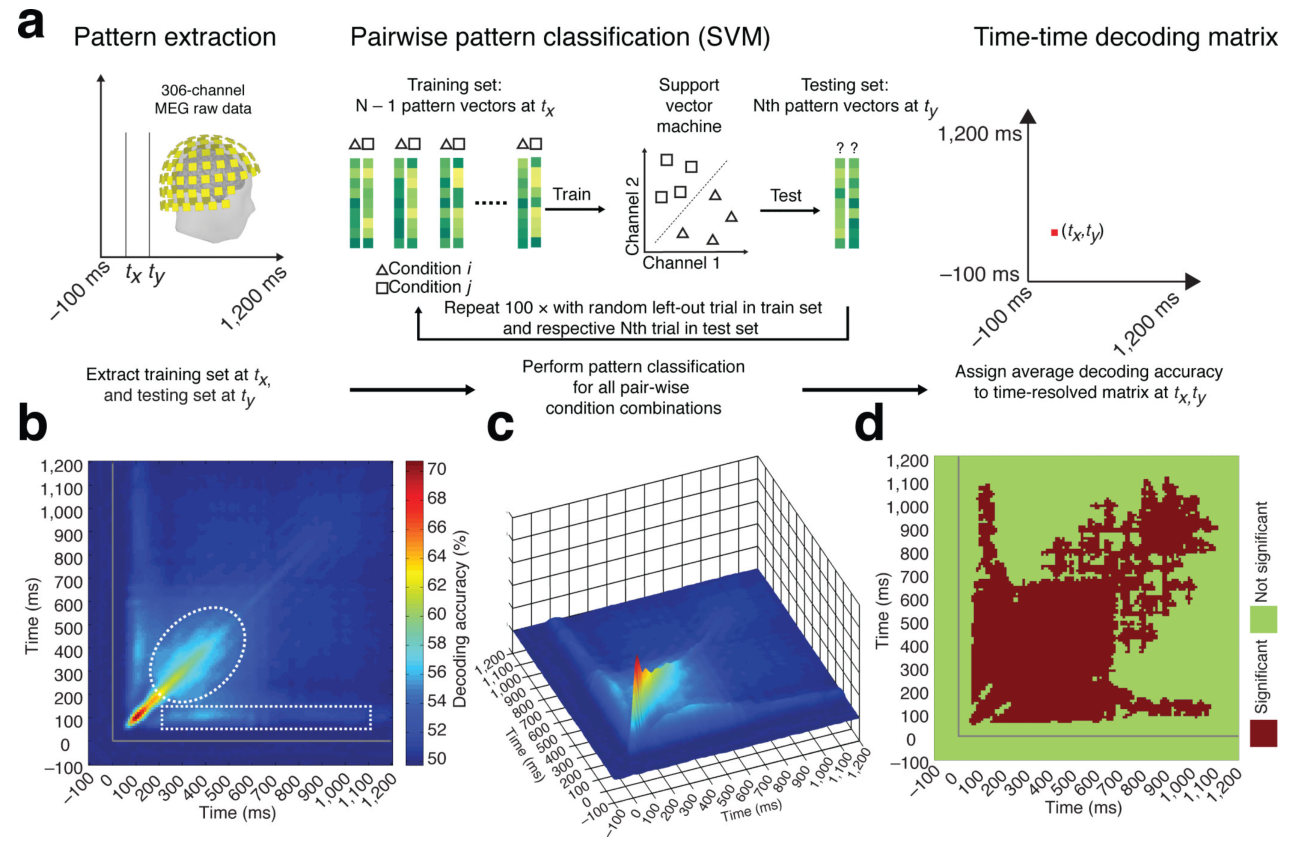
图 4 · MEG 与 fMRI 在 V1 和 IT 上的对接
原文图注:Figure 4. Relating MEG and fMRI signals in V1 and IT. (a) We select voxels in two regions-of-interest (ROI): V1 and IT, For each condition, we extracted voxel activation values, yielding 92 pattern vectors., we calculated pairwise Pearson's correlation (R) for all combinations of experimental conditions (i,j). The dissimilarity measure 1–R was assigned to a 92 × 92 fMRI dissimilarity matrix indexed by the experimental conditions (i,j). This analysis was conducted independently for each ROI. (b) For each time point t, we correlated (Spearman's rank-order correlation) the MEG decoding matrix to the fMRI dissimilarity matrices of V1 and IT. (c) MEG signals correlated with V1 earlier than with IT. Blue and red stars indicate significant time points for V1 and IT. (d) Difference curve between the two curves as in (c). MEG correlated early more with V1 than with IT, and later more with IT than with V1. Green and red stars in the plots indicate significant time points for positive and negative clusters respectively. For details see Supplementary Table 1d. n=16, Gray line and statistical procedure same as in Fig. 1.
(a) 展示从 fMRI ROI 体素响应构建 92×92 不相似性矩阵的过程;(b) 示意将各时间点的 MEG 解码矩阵与 V1 和 IT 的 fMRI 矩阵进行 Spearman 相关计算;(c) 展示两组相关时程曲线,V1 峰值(101 ms)先于 IT 峰值(132 ms);(d) 展示两曲线的差值,早期差值为正(V1 相关性占优),晚期差值为负(IT 相关性占优)。
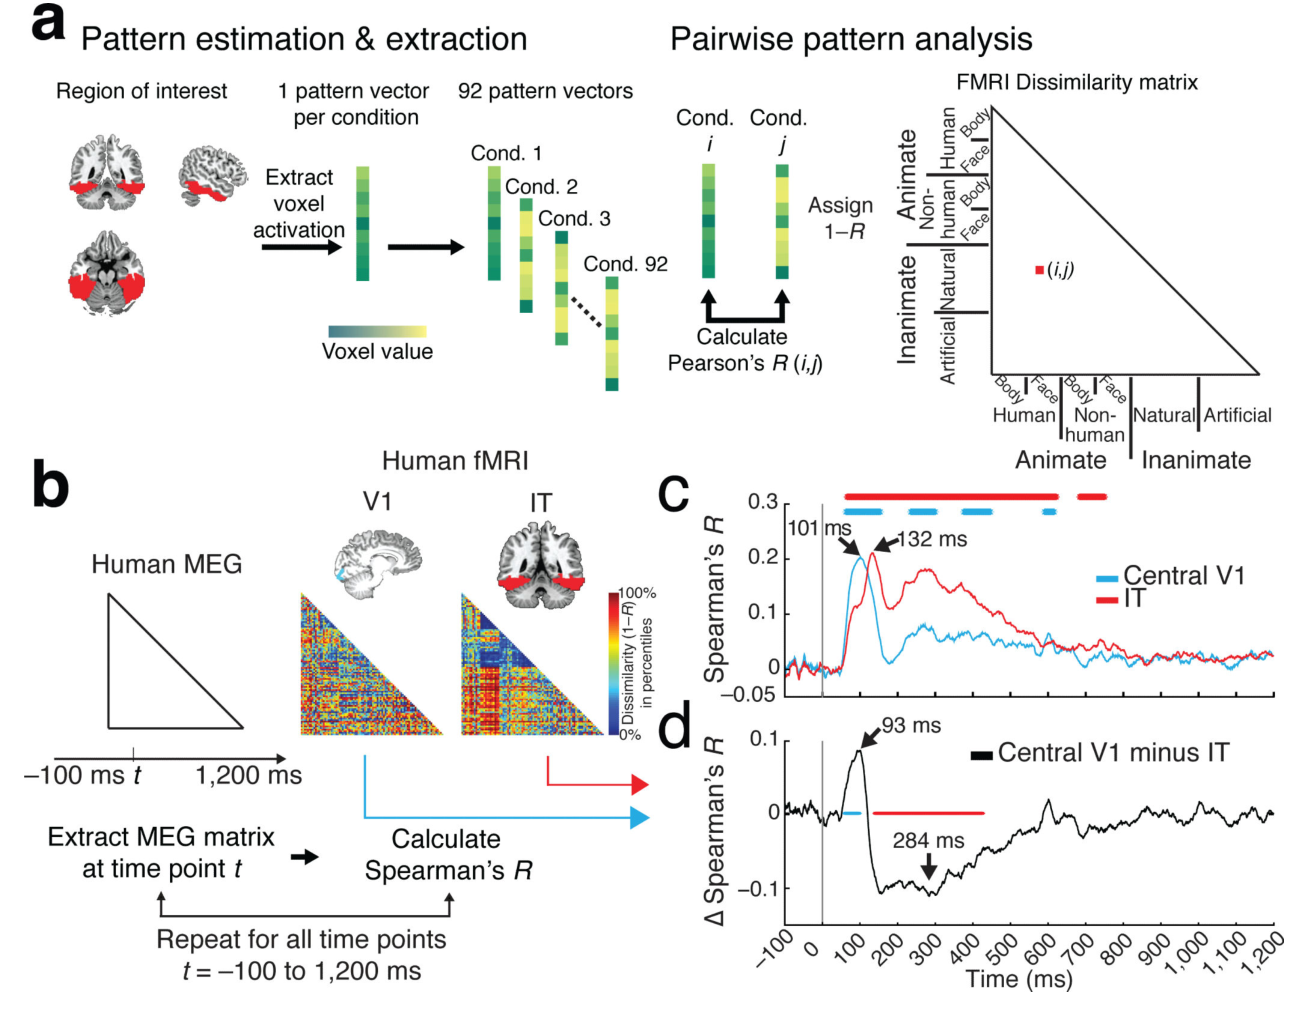
图 5 · 定位持续活动的皮层源头
原文图注:Figure 5. Relating MEG and fMRI signals across time. (a) 92 × 92 decoding matrices were extracted for each combination of time points (tx, ty), and were correlated (Spearman's rank-order correlation) with the fMRI dissimilarity matrices for V1 and IT. The resulting correlation was assigned to a time-time MEG-fMRI correlation matrix at tx,ty. (b,c) Top panel displays the time-time MEG and fMRI correlation matrix for V1 and IT. Bottom panel shows significant cluster results (n=16, cluster-defining threshold p<0.0001, corrected significance level p<0.05). Neural activity for the time point combinations of ~100ms and ~200–1,000ms (marked by white dotted rectangle) correlated with V1. (c) Neural activity between ~250ms and ~500ms (marked by the striped white ellipse) correlated with IT. (d) Difference between V1 and IT. Gray lines as in Figure 1.
对各时间点组合 (tx,ty) 的 MEG 泛化矩阵分别与 V1 (b) 和 IT (c) 的 fMRI 差异矩阵求相关,下排为统计显著簇,(d) 为二者差值。白色虚线框标示的时段(~100 ms 与 ~200–1000 ms 组合)主要与 V1 表现出显著相关,条纹椭圆区域(~250–500 ms)主要与 IT 表现出显著相关,说明两类持续活动在解剖区域上存在对应分离。
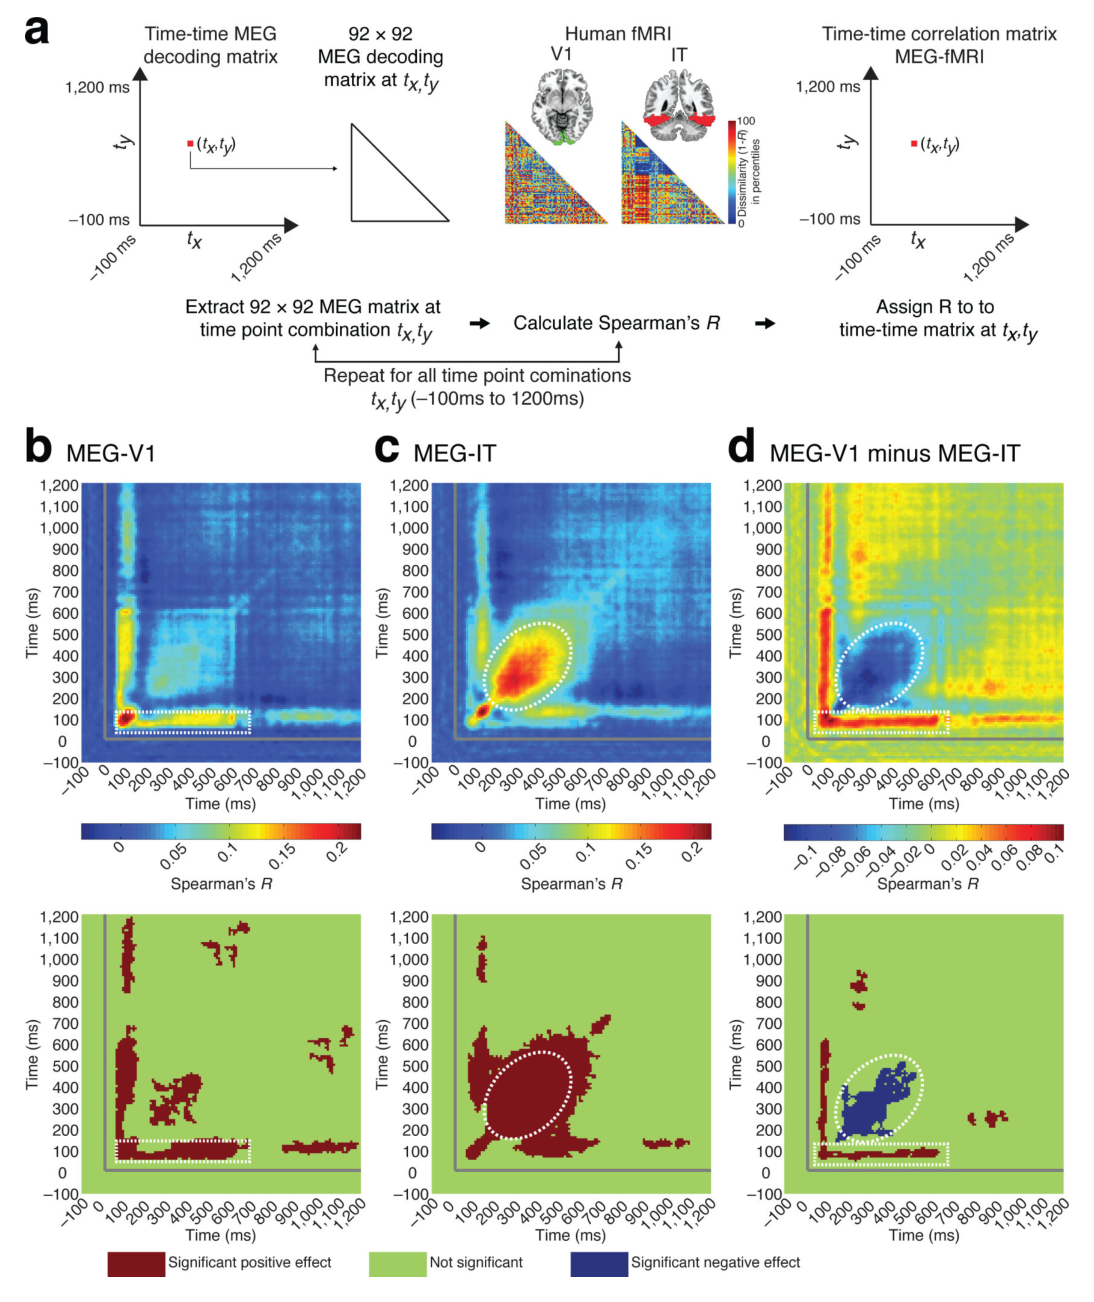
图 6 · 人类 MEG 与猴 IT 单细胞表征的对齐
原文图注:Figure 6. Relating human MEG and electrophysiological signals in monkey IT. (a) The MEG decoding matrix at time t was compared (Spearman's rank-order correlation R) against the monkey dissimilarity matrix in IT. The lower form of the monkey IT matrix is shown as percentiles of 1–R. (b) Representational dissimilarities in human MEG and monkey IT correlated significantly starting at 54ms (52–64ms), with a peak latency of 141ms (132–292ms). c) MDS at peak-latency. d) Results at the fine-grained level of the image set. Representational dissimilarities were similar across species and methods even for the finest categorical subdivision of the image set. n=16, stars and gray line same as in Figure 1.
(a) 将人类逐时点 MEG 解码矩阵与猕猴 IT(674 个神经元在 71–210 ms 窗口平均放电率计算的差异矩阵)进行 Spearman 秩相关对比;(b) 相关时间曲线显示两物种表征在约 66 ms 起具有统计相关性(图注标注起始点为 54 ms),峰值位于 141 ms;(c) 峰值时段 MDS 映射表明人脸维度构成表征区分的重要部分;(d) 子集内限制分析显示在精细类别划分下两组数据依然保持相关。
讨论
研究整合了物体识别的时间与空间演变特征:单个图像在较早阶段(峰值 102 ms)完成辨别,高级类别与具体子类随后(122–190 ms)被显性表征。由于各类别层级的起始显著时间相对较早(48–70 ms),作者倾向于认为视觉系统在早期即开始并行累积各类别的特征证据,而不是严格串行的多阶段加工模式;但由于 MEG 为全脑宏观信号,无法单独分离局部微环路的早晚期放电位相。V1 与 IT 的跨模态时间对齐与以往神经生理学关于两脑区响应起始与峰值的时程测量相符。
关于持续表征,分析显示早期低层特征与晚期类别属性在时间上均能够延续至刺激呈现之后,可能反映了视觉系统在不同皮层层级上对输入特征的维持。在跨物种对比中,猕猴 IT 矩阵基于固定时间窗放电率计算,因此相关曲线的时间动态主要由人类 MEG 信号的时序变化体现。该研究证明了利用 RSA 建立无创神经影像(MEG、fMRI)与侵入式电生理数据统一表征参照系的可行性。
一句话总结
本研究利用 RSA 框架在统一图像刺激下将人类 MEG 时间进程与 fMRI 空间定位及猕猴 IT 电生理记录进行对齐,确定了单图及各类别层级的解码时延,并证实瞬态与持续表征分别对应于 V1 与 IT 等不同皮层层级。