该研究考察下颞叶(IT, inferior temporal cortex)局部神经活动是否足以支撑视觉联结学习的充分性问题。实验在猕猴学习新异视觉图形分类的同时引入 IT 电微刺激,使皮层电流本身作为分类决策的区分线索。结果表明,微刺激足以建立特定按键分类联结,且习得刺激在测试阶段系统性偏置动物对未曾训练的新混合图形的选择偏好;该学习效应在邻近的听觉反应皮层微刺激中无法建立,从而将既往的选择性改变与损毁损伤等关联观察推进为皮层活动驱动行为学习的因果链条。
研究背景
IT 神经元对复杂物体及其特征组合具有选择性,学习又会改变这些反应,因此 IT 被认为参与视觉联结学习。既往证据主要有两类:视觉—视觉、视觉—运动或视觉—奖励联结形成后,IT 选择性发生相关变化;IT 损伤或失活则会损害既有辨别并减慢新学习。这些结果说明 IT 与学习有关且可能是必要的,却不能回答一个人为增加的 IT 活动模式是否足以成为学习线索。相关观察无法主动制造差异,失活实验也只能去除信号,充分性需要直接刺激来检验。
早期皮层刺激研究曾用较大电流把刺激作为条件线索,近年的 MT、S1 微刺激则多利用已存在的功能选择性来偏置知觉。本文的情况更严格:视觉图形对猴子是新异的,刺激位点按视觉反应而非特定图形偏好选择,因此不是简单激活一个已知“某物探测器”。同时,若猴子只是把电流与按键直接关联,或仅学习“有电/没电”,还不能说明电流与视觉物体表征发生了联结。实验需要逐步改变电流的信息结构,并检验效应是否具有脑区和图形特异性。
作者先让同一张模糊图形在有无 IT 微刺激时对应不同按键,再用纯刺激试次排除直接运动反应;随后让所有试次都带电,只改变电与视觉的相对时序,排除单纯存在检测;最后在学习后把电流叠加到新的混合图形上,观察选择是否向原配对方向偏移。真实听觉线索和邻近听觉区刺激作为外部对照。这样形成从相关到充分性的因果证据,但它仍不能证明记忆痕迹就储存在 IT:电流可能与 IT 内视觉信号交互后,经额颞、颞纹状体或其他下游回路建立联结。
研究思路
研究设计建立在逐步排除替代假说的逻辑阶梯上。第一阶,排他性线索检验:同一张模糊视觉图形同时对应左、右两个按键,正确决策完全取决于当前 IT 是否伴随微刺激;若局部诱发活动足以支持分类学习,猴应能建立稳定的选择行为。第二阶,排除单纯运动反射假说:插入无视觉图形的纯电刺激试次,检验电刺激是否能直接诱发按键动作;并在第二组模糊图形中反转刺激与按键的映射关系,检验学习是否与特定图形绑定。第三阶,条件性时序线索检验:消除“有电/无电”的存在性线索,在所有模糊试次中均给予固定 200 ms 的电刺激,仅改变电刺激与视觉呈现的相对时序(电刺激超前视觉 200 ms 对比滞后视觉 75 ms),检验相对时间差能否作为分类依据。第四阶,选择偏好转移与特异性检验:在训练期建立微刺激与四张图形之一的联合呈现,测试期采用透明度混合技术合成新刺激,评估电刺激能否系统性偏置动物在模糊边界处对新图形的选择;并通过对比包含与不包含训练图形的混合刺激,检验偏置的刺激特异性。外部对照链条进一步考察替代线索:使用真实世界声音线索替代微刺激,以及将刺激电极移至邻近的听觉反应皮层,检验该效应的解剖区域特异性。
方法
实验动物为 3 只恒河猴(体质量 8–11 kg),头部固定,记录舱植入于单侧半球(立体定位坐标 AP 17 mm、ML 20 mm,垂直进入颞叶皮层)。采用钨丝微电极(阻抗 250 kΩ–1.0 MΩ)记录前下颞叶多单元活动并寻找视觉反应位点;结合电极行进轨迹中的灰白质边界与解剖坐标,将位点定位在细胞构筑区 TE 附近(ventral area 36 外侧、TEO 前方)。电刺激由恒流隔离器输出,波形为 200 Hz、脉宽 200 µs 的双相方波脉冲,回路串联 1 kΩ 电阻实时监测实际输送电流。刺激呈现于 22 英寸 CRT 显示器(刷新率 100 Hz,视距 119 cm),眼位通过 EyeLink II 高速红外眼动仪监测,实验时序由 QNX 实时系统控制。
任务结构包含四类设计:1)消歧任务——每会话引入 3 张全新彩绘图案(乌克兰彩蛋),2 张分别对应左、右按键(distinct 明确图形),第 3 张图形两键均可且正确映射仅由电刺激的有无决定(ambiguous 模糊图形),视觉呈现与微刺激时长约为 1 s(按键提前发生时二者同步终止);2)相对时序任务——视觉呈现 200 ms,模糊图形在所有试次均伴随 200 ms 微刺激,一半试次电刺激超前视觉 200 ms、另一半在视觉呈现 75 ms 后开始,视觉与电刺激的绝对起始时间在试次间随机抖动,电流强度测试 30 µA 与 60 µA 两档;3)解剖区域特异性对照——采用一只熟悉分类规则但未接受过微刺激训练的实验猴,隔日交替在 IT(75 µA)与邻近听觉区(LFP 定位,距 IT 约 6 mm,解剖位于更浅层的 TPO/TAa 附近)各测试 400 试次,连续开展 10 轮轮换;4)混合图形泛化任务——每会话引入 4 张全新邮票图案(2 张直立、2 张旋转 45°),其中 1 张直立图案在训练期 100 次呈现中恒定伴随 200 ms、30 µA 微刺激(刺激位于视觉呈现后 75–275 ms);随后通过 alpha 通道比例混合直立对或旋转对合成新刺激,先经预试以 logistic 函数拟合主观中点,选取中点附近对应 30%、50%、70% 右选概率的 3 个混合比进行测试(模糊测试试次均以 75% 固定概率给予奖励)。统计分析中,学习成功判定基于每条件最后 48 试次的二项分布检验;选择偏置通过 logistic 回归的刺激项系数(似然比检验)结合 Wilcoxon 符号秩检验评估;反应时采用双因素 ANOVA(刺激×选择);首扫视着陆点通过 ROC 曲线下面积量化眼动分离度。
主要结果
- IT 微刺激足以消歧同一视觉图形的分类映射:在 24 次独立实验中(猴 S 与猴 J 各 12 次),21 次观察到统计学显著的学习(P<0.05,二项检验);模糊条件的平均正确率为 79%(猴 S 为 82%、猴 J 为 76%),明确对照图形正确率达 98%。明确图形约重复 10 次即可达到 80% 正确率,而模糊图形学习速度相对较缓;跨会话的学习速率保持稳定,未观察到跨天渐进的“学会学习”倾向(图 1)。
- 排除非特异运动触发与眼动线索:在正确率达到 80% 的 5 个会话中混入无视觉图形的纯电刺激试次,两只实验猴在 5 s 超时时限内均未发生按键,表明微刺激本身不足以作为独立的运动驱动信号;眼动分析显示,明确图形的首扫视轨迹按类别明显分化,而模糊图形在有电与无电试次间的扫视轨迹重合度高,仅猴 J 在训练后期表现出微弱的扫视终点与正确率相关(r=0.58, P=0.05),表明眼动分离是决策建立后的伴随反应而非学习的感知来源(图 2)。
- 相对时序特征可支持分类学习并具备电流强度依赖性:当所有模糊试次均伴随微刺激且仅依靠电与光刺激的前后相对时序作为判定线索时,在 30 µA 电流下 12 次实验中有 4 次达成显著学习(33%),电流提高至 60 µA 后显著学习率上升至 10/13(77%),排除了动物仅依赖“检测刺激存在与否”完成任务的解释(图 3)。
- 分类学习效应具备解剖区域特异性,真实声音线索无法替代:将微刺激替换为与视觉同步呈现的真实环境声音(70–74 dB SPL),两只实验猴在 14 次实验中均未建立有效学习(平均正确率 49%),尽管外周朝向测试确认动物听觉感知正常;在隔日交替测试中,IT 刺激在 10 次中达到 8 次显著学习(平均正确率 68 ± 12%),而邻近听觉区刺激仅 1 次显著(平均正确率 52 ± 6%),两脑区学习效果差异显著(Wilcoxon 秩和检验,P<0.001)(图 1D、图 4)。
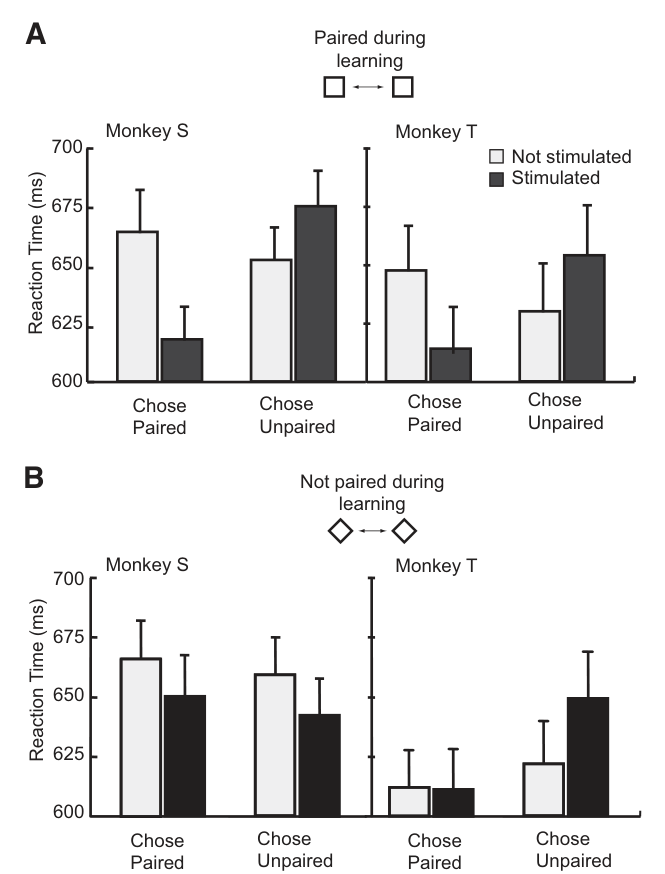
- 电刺激系统性偏置对新混合图形的知觉选择且具有刺激特异性:在混合图形测试中,logistic 回归的刺激系数显示,包含训练期配对图形的混合刺激产生显著的选择偏置(猴 S 系数为 0.67,猴 T 为 0.31,似然比检验均 P<0.001);而在不包含配对图形的旋转混合测试中,偏置效应显著衰减(猴 S 为 0.2,猴 T 为 0.09,非显著),效应量均值由 11.0% 下降至 3.5%(衰减幅度达 68%,Wilcoxon 符号秩检验 P<0.001)。反应时同步变化:施加微刺激后,选择与配对图形对应按键的反应时显著缩短,而选择反向按键的反应时显著延长(交互作用在两只猴中均达显著),未配对混合刺激中未见该反应时调制(图 5–8)。
图注解读
图 1 · 用 IT 电刺激消歧图形:任务、学习曲线与听觉对照
原文图注:FIG. 1. Electrical stimulation in inferior temporal cortex (IT) to disambiguate visual patterns. A: single trial in the basic discrimination task consisted of the presentation of a fixation square followed by a visual stimulus for ±1 s, the monkey's response (left or right button press), and a feedback signal (tone, plus juice reward on correct trials). B: for each session in this experiment, 3 novel images of painted Ukrainian eggs were selected and mapped to button responses as shown. Two of the 3 images were unique and assigned to the left and right buttons (distinct). The 3rd image was assigned to both the left and right buttons and could only be distinguished by accounting for the presence or absence of the electrical stimulation (ambiguous). During the experiment, the 4 stimuli were randomly interleaved on separated trials. C: learning curves for 3 sessions (top and middle rows are from microstimulation sessions, bottom row is from an auditory stimulation session), comparing performance for trials containing the 2 distinct stimuli (left) and the 2 visually ambiguous stimuli (right). Learning in the distinct condition required 10 stimulus repetitions to achieve 80% correct performance. In the ambiguous condition, learning proceeded more slowly. The side assigned for ambiguous plus electrical stimulation is denoted on the top of plots. In 1 experiment (middle row), we introduced a 2nd ambiguous set (indicated by a gray vertical line) after learning of the 1st set was complete. The response mapping for the second ambiguous plus stimulation pair was reversed. In this case, the monkey showed a chance level performance for initial trials and proceeded to learn the new mapping without interference from or interfering with performance on the already learned stimuli. D: comparing the effects of electrical microstimulation with auditory stimulation. Bars show average performance for the last 48 trials in conditions where stimuli could be distinguished based on visual differences (Visual/Visual), on the presence or absence of electrical microstimulation (Visual/IT microstimulation), and on the presence or absence of auditory signals (Visual/Auditory). Each circle represents performance from each experiment. Filled circle, session showed significant learning effects; open circle, no significant learning. Performance in the electrical microstimulation condition was clearly superior to that in the auditory condition, showing that integration of disambiguating information does not always occur. Error bars denote SD.
解读:A、B 图示意按键映射方案,重点展示模糊图形如何依据电刺激的有无分别映射至左、右键。C 图展示学习曲线:明确图形在 10 次重复内快速达成 80% 正确率,模糊图形学习时程明显拉长;中行在完成首轮学习后引入映射规则反转的第二组刺激,猴从随机水平重新建立关联,两组间无明显干扰。D 图对比最后 48 试次表现:视觉差异与 IT 微刺激条件均支持高水平分类,而真实声音条件基本处于 49% 随机水平。该图支持主要结果第 1、2 条与第 4 条前半部分。
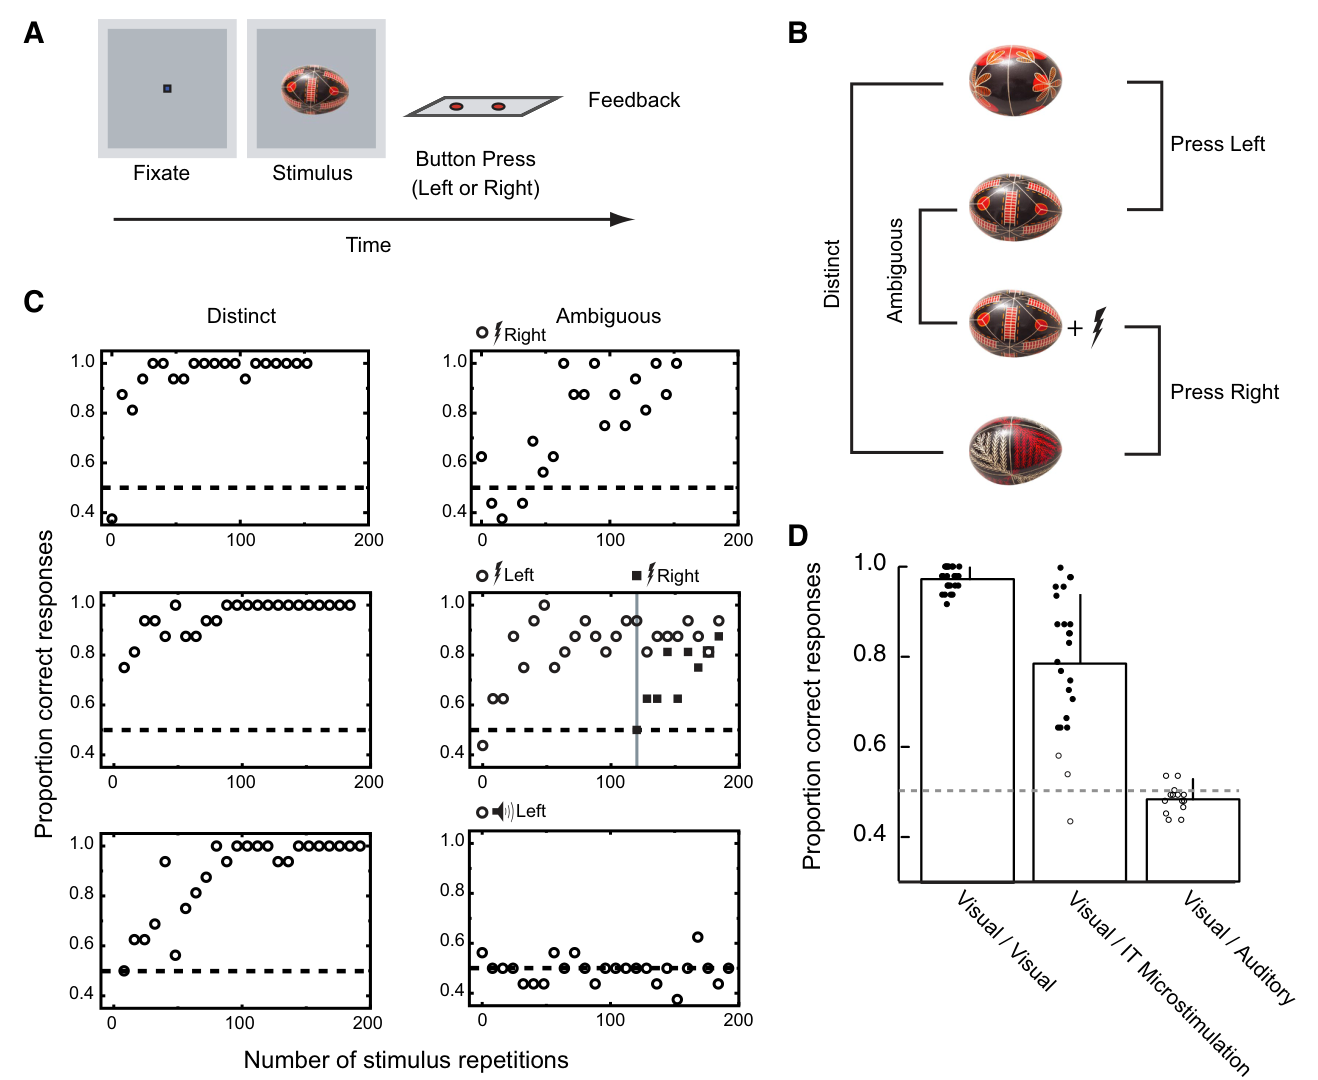
图 2 · 首扫视对照:眼动分离不解释学习
原文图注:FIG. 2. Initial saccades in the distinct and ambiguous conditions. A: initial saccade trajectory and histograms of saccade endpoints from individual sessions. Positive value in horizontal and vertical eye displacement indicates displacement to the right and up, respectively. Top row: data from monkey S. For a distinct visual stimulus pair (top left panel), saccades for one stimulus, which was assigned to left button pressing (trajectory and histogram shown in black), and another stimulus, which was assigned to right button pressing (trajectory and histogram shown in green), showed a segregated trajectory. Stimuli used for each condition is inset left above of the trajectory panel. For an ambiguous pair (top right panel), saccades showed similar overall profile but no clear separation between unstimulated condition, which was assigned to left button pressing (trajectory and histogram shown in black), and stimulated condition, which was assigned to right button pressing (trajectory and histogram shown in red). Stimuli used for each condition is inset left above of the trajectory panel. A scatter plot placed under the each eye trajectory panel represents behavioral learning curve from the same session. Another example session from monkey J is shown on bottom row. In this case, stimulated condition (trajectory and histogram shown in red) was assigned to left button pressing. B: eye separation and behavioral performance in the ambiguous condition. Population data from monkey S (12 sessions) and monkey J (12 sessions) are shown in left and right panels. Ordinate (for eye separation) shows area under the curve with receiver operating characteristic (ROC) analysis for endpoint positions in horizontal axis. Abscissa (for behavioral performance) shows mean correct rate at the period that the eye separation is calculated. Each point represents data from 24 trial repetitions. Symbols represent learning phase (periods within each session). Red filled circle indicates initial 24 repetitions at the beginning of each session (early blocks). Pink unfilled square indicates last 24 repetitions of each session (late blocks). Unfilled circle indicates middle phase between initials and lasts (middle blocks).
解读:A 图展示典型会话中的扫视轨迹与终点分布:明确图形在刺激呈现初期即表现出按目标位置分流的眼动轨迹,而模糊图形在有电(红)与无电(黑)试次间未见明显的轨迹空间分离。B 图绘制了每 24 试次块的 ROC 眼动分离度对该时段正确率的散点关系:猴 S 无显著相关,猴 J 仅在后期试次块中显现弱相关,表明眼动轨迹分化是决策建立后的运动伴随反应,不支持将眼动作为学习前置线索的解释。支持主要结果第 2 条。
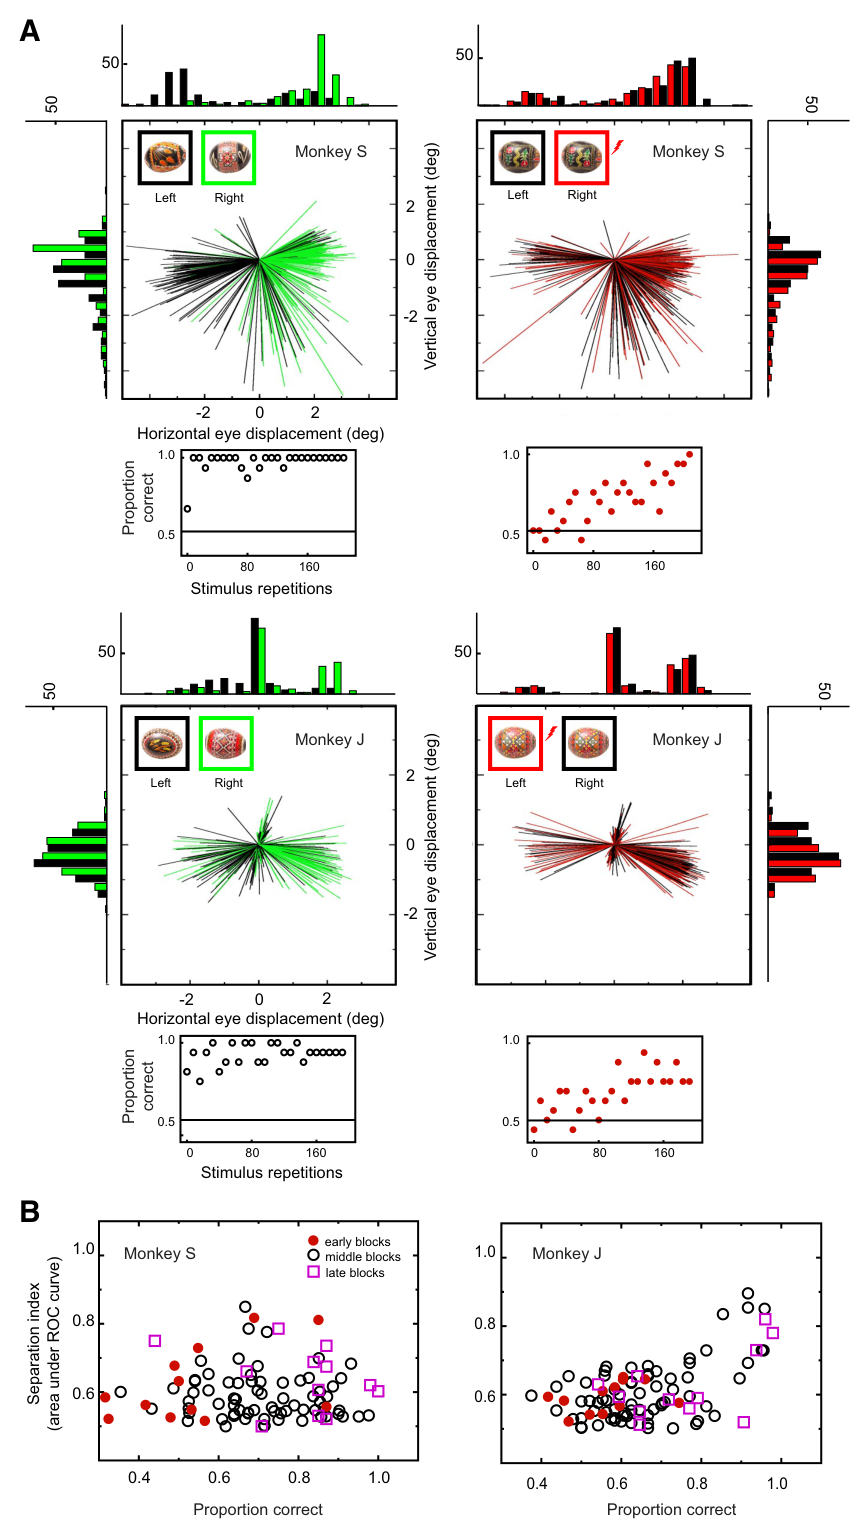
图 3 · 相对时序任务:检测到"有电"还要知道"何时"
原文图注:FIG. 3. Sensitivity to relative timing between electrical and visual stimulation. A: the paradigm was similar to that shown in Fig. 1 except that all visually ambiguous trials included a 200-ms train of electrical stimulation (200 Hz, 200 µs width biphasic pulses). New stimuli and stimulation sites were selected for each experiment session. The relative timing between the onset of the electrical and visual stimulus determined the proper button mapping for each ambiguous pair. B: proportion correct for the final 48 trials is shown for both the visual distinct control stimuli (left 2 columns) and the visual/electrical pairs (middle and right columns). With current levels set to 30 µA (circles), learning was evident in 4/12 experiments (filled symbols). At 60 µA (squares), we observed significantly above chance performance in 10/13 experiments (filled symbols).
解读:A 图示意相对时序变式设计,所有模糊试次均施加微刺激,仅依赖电刺激超前还是滞后于视觉呈现来区分按键。B 图对比末尾 48 试次的准确率:明确对照组稳定保持在 0.8–1.0;30 µA 模糊条件下有 4/12 次实验达成显著学习(中列实心点),60 µA 条件下显著学习比例提升至 10/13(右列实心点)。强度的正向调节表明时间相对关系可被神经系统解析为分类信息,排除了单纯检测刺激存在的假说,支持主要结果第 3 条。
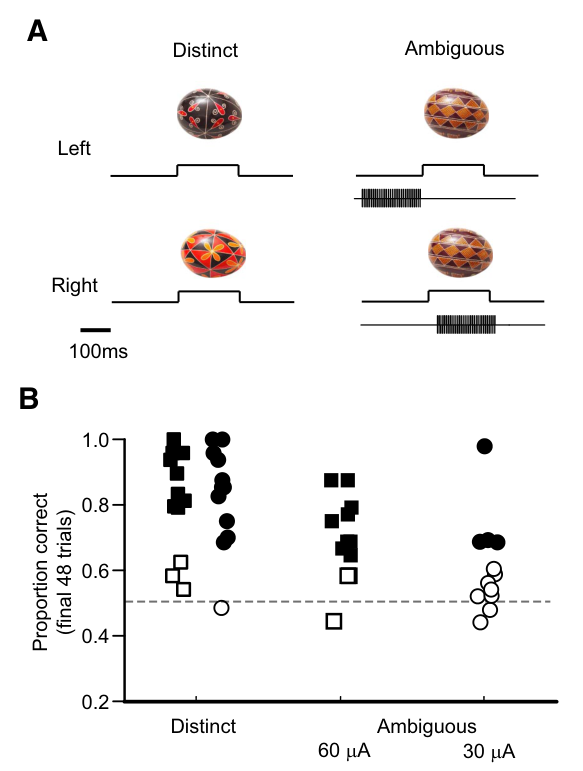
图 4 · 同类学习在听觉区不成立
原文图注:FIG. 4. Areal specificity of learning effects. A, left: depth profile of local field potentials (LFPs). Illustration of the estimated coronal brain section superimposed on LFPs evoked by auditory (green line) and visual (red line) stimuli. Right: an alternate day training schedule was applied to microstimulation learning in a learning naïve monkey to compare learning rates for stimulation in visual and auditory responsive areas. B, left: averaged learning curve from 10 IT stimulation experiments. Performance (y axis) for distinct condition (unfilled circles) and ambiguous condition (filled red circles) is plotted against number of stimulus repetitions. Right: average learning curve from ten auditory area stimulation experiments. Performance (y axis) for distinct condition (unfilled circles) and ambiguous condition (filled green circles) is plotted against number of stimulus repetitions. Error bars denote SD. C, left: averaged LFP from 10 IT stimulation sites. Right: averaged LFP from 10 auditory area stimulation sites. Red line shows response for visual stimuli. Green line shows response for auditory stimuli. x axis represents time after onset of visual and auditory stimulus. Y axis represents amplitude of LFP.
解读:A 图左侧通过 LFP 深度剖面证实,在同一穿透轨迹相隔约 6 mm 的深度上可分别记录到视诱发(红)与听诱发(绿)反应层。B 图对比 IT(左)与听觉区(右)各 10 次实验的平均学习曲线:IT 微刺激支持稳定的模糊条件学习(红实心点,8/10 显著),而听觉区微刺激基本维持在随机水平(绿实心点,仅 1/10 显著)。C 图展示了两类位点的平均 LFP 验证电极定位。该对照证实人工神经活动驱动视觉分类具有解剖特异性,支持主要结果第 4 条。
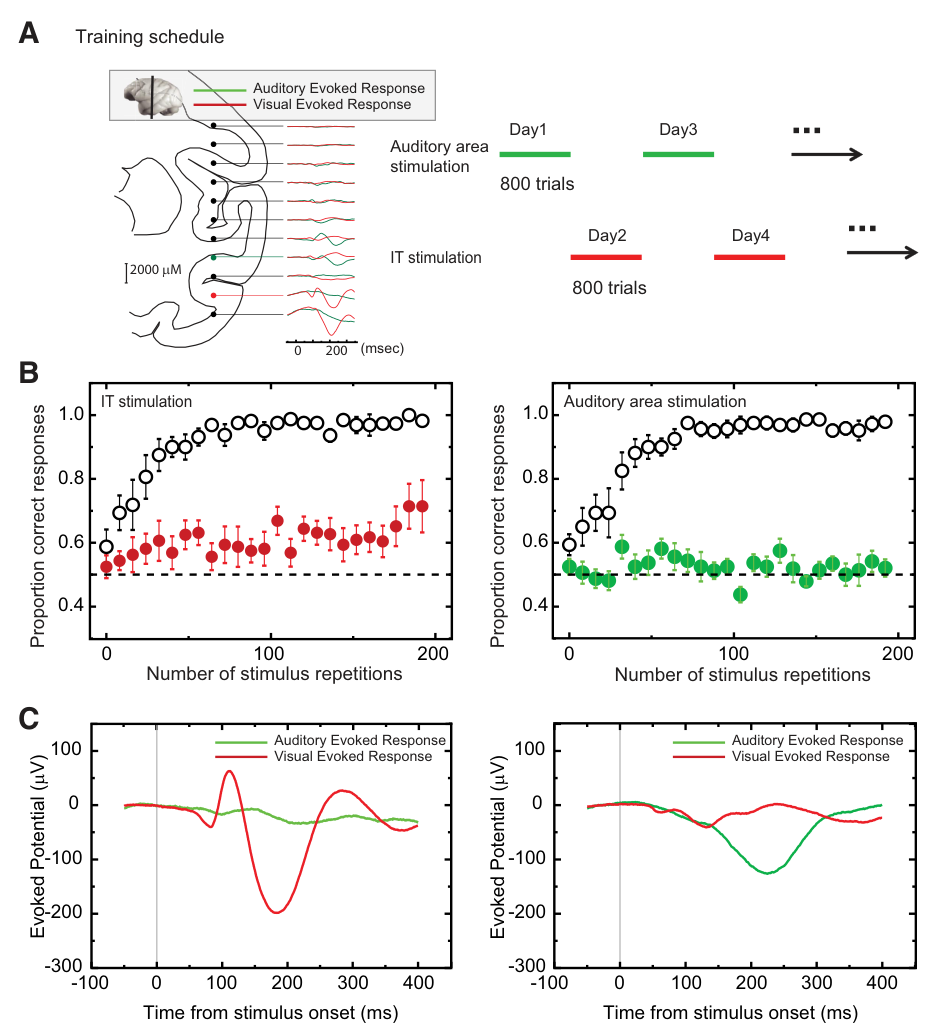
图 5 · 泛化任务设计与学习期对照
原文图注:FIG. 5. The effects of IT microstimulation during visual classification learning when microstimulation is informative, but not required, for classification. A: in this task, 4 new images of stamps were selected before each test session. Random colored noise was added to each stimulus to introduce initial variability during the discrimination task. Two stimuli were shown upright, and 2 were rotated 45°. Microstimulation was included on all trials containing 1 of the 2 upright stimuli (randomly assigned to either the left or right in each session). Thus during learning, 1 of 4 patterns was always experienced with the microstimulation present. Inset: the recorded analog return signal from the stimulating electrode, which verified the timing and amplitude of the microstimulation. The rotated stamps served as control stimuli in each experiment. B: performance plotted as a function of number of stimulus repetitions shows that for this task, the additional microstimulation (filled circles) did not significantly affect learning rates of the patterns assigned to the stimulation condition compared with performance for unstimulated stimuli (open circles). By 100 stimulus repetitions per stimulus, performance was between 90 and 100% for both trial types.
解读:A 图展示泛化任务所用的 4 张邮票图案,其中仅 1 张直立图案伴随微刺激呈现,插图为刺激回路监测信号。B 图展示训练阶段学习曲线:伴随刺激与无刺激的图案学习进程高度重合,经 100 次呈现后准确率均达到 90–100%,表明在明确图案的辨别学习中微刺激并未改变基线学习速度,这为后续测试阶段剥离出的选择偏置提供了基线控制。
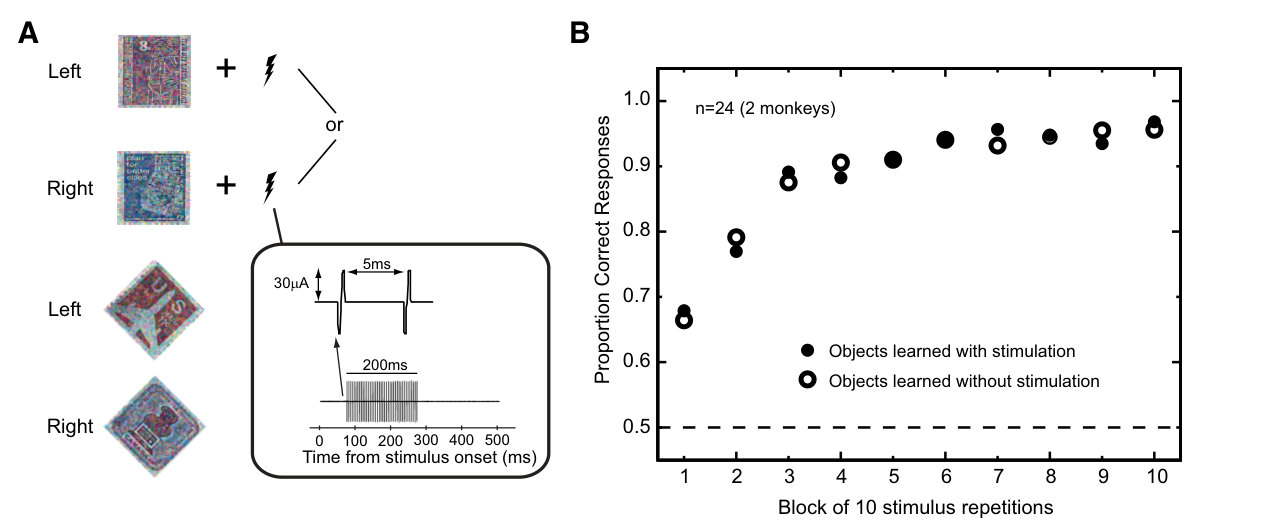
图 6 · 单次实验中的心理测量曲线与电流偏置
原文图注:FIG. 6. The effect of electrical microstimulation on the classification choices for novel stimuli composed of image mixtures. A: psychophysical performance from a single behavioral experiment shows the systematic effect of varying the stimulus content from 100% left stimulus to 100% right stimulus. After a learning phase consisting of 100 repetitions for each of the individual stamps, stimulus blends were created by mixing the 2 stamps from the same orientation condition (upright or rotated) in various proportions. A brief pretest with fixed blend ratios (see METHODS) was administered, and the data were fit to a sigmoid function to estimate the midpoint for response selection (which was not always at the 50% blend level). Three levels of mixing around this subjective midpoint were then used for the main test condition. The abscissa for these plots represents the proportion of the right stimulus at each point, and the ordinate shows the proportion of right responses chosen. At the extremes, the animal's choices were close to perfect and choices between the 2 extremes varied smoothly and systematically as a function of blend proportion. B, left: comparison of stimulated (filled circles) and unstimulated (open circles) trials shows a systematic shift in response proportion upward in the direction of the response associated with the stimulus paired with microstimulation during learning. The microstimulation induced shift was measured as the average response difference between the stimulated and unstimulated conditions in the ambiguous region of the response curve (data appeared on gray background). Right: effect of microstimulation on trials from the same experimental session containing mixtures of images neither of which had been previously been associated with microstimulation. There is transfer of the effect of microstimulation (for this experiment, microstimulation biased choices to favor the right hand response), but the magnitude of this shift was systematically smaller than that observed for the visual mixtures that included the previously associated image (see Fig. 7).
解读:A 图展示基于混合比例变化的典型 S 型心理物理曲线。B 图左侧显示在包含训练伴随图案的混合刺激中,微刺激试次(实心点)相对无刺激试次(空心点)在灰色模糊区间整体向训练配对的按键方向平移;右侧显示在未配对的旋转混合图案中该平移显著减弱,直观呈现了人工活动偏置行为选择及其刺激特异性,支持主要结果第 5 条。
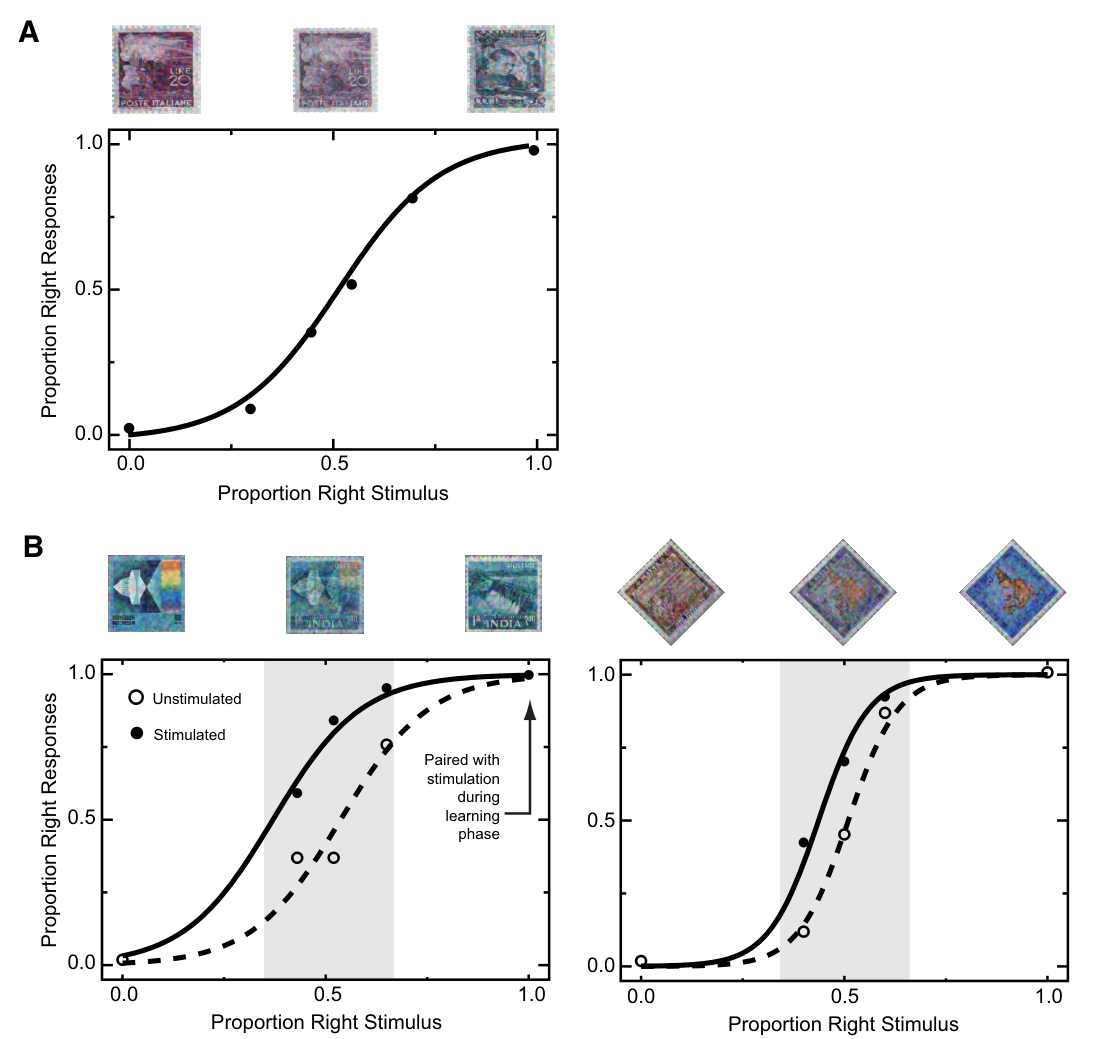
图 7 · 群体效应与特异性的量化
原文图注:FIG. 7. Stimulation induced response shifts and a test of stimulus specificity. A: population plots and psychometric functions from monkey S (12 experiments, top row) and monkey T (12 experiments, bottom row). F and E, responses with and without electrical stimulation, respectively. — and - - -, fitted psychometric functions for trials with and without electrical stimulation. The psychometric function is obtained by logistic regression analysis for the choices made in response to the stimuli mixture containing the image previously been associated with microstimulation (left) and for mixtures wherein neither of the source images had been previously associated with microstimulation (right). B: 24 experiments were conducted in 2 monkeys comparing the response to ambiguous stimulus blends (Fig. 6) with and without stimulation. Effect size (abscissa) is measured in terms of response bias with positive indicating more responses in the direction of the unblended stimulus that had been paired with stimulation during learning. On average, both monkeys showed a significant shift in the expected direction with a mean amplitude across the set of experiments of 11%. C: the specificity of the stimulation effect was assessed by comparing the shift in response bias caused by microstimulation between the blends of upright stamps (which always included the stimulus that had been learned with microstimulation) and the rotated blends. The mean effect size across the 24 experiments decreased by 68% in the transfer condition (P < 0.001, Wilcoxon signed-rank test). Thus the efficacy of the stimulation did depend in part on the interaction between the visual patterns presented and the presence or absence of microstimulation. Error bars denote standard errors.
解读:A 图聚合两只猴各 12 次实验的群体心理测量曲线,左列(包含训练图案)实线显著偏离虚线,右列(对照图案)偏离微弱。B 图为 24 次实验的效应量分布,平均偏置幅度为 11%。C 图直接对比配对混合与旋转迁移混合:效应量由 11.0% 下降至 3.5%(衰减 68%,P<0.001),统计确认了刺激与特定视觉构型之间的交互效应,支持主要结果第 5 条。
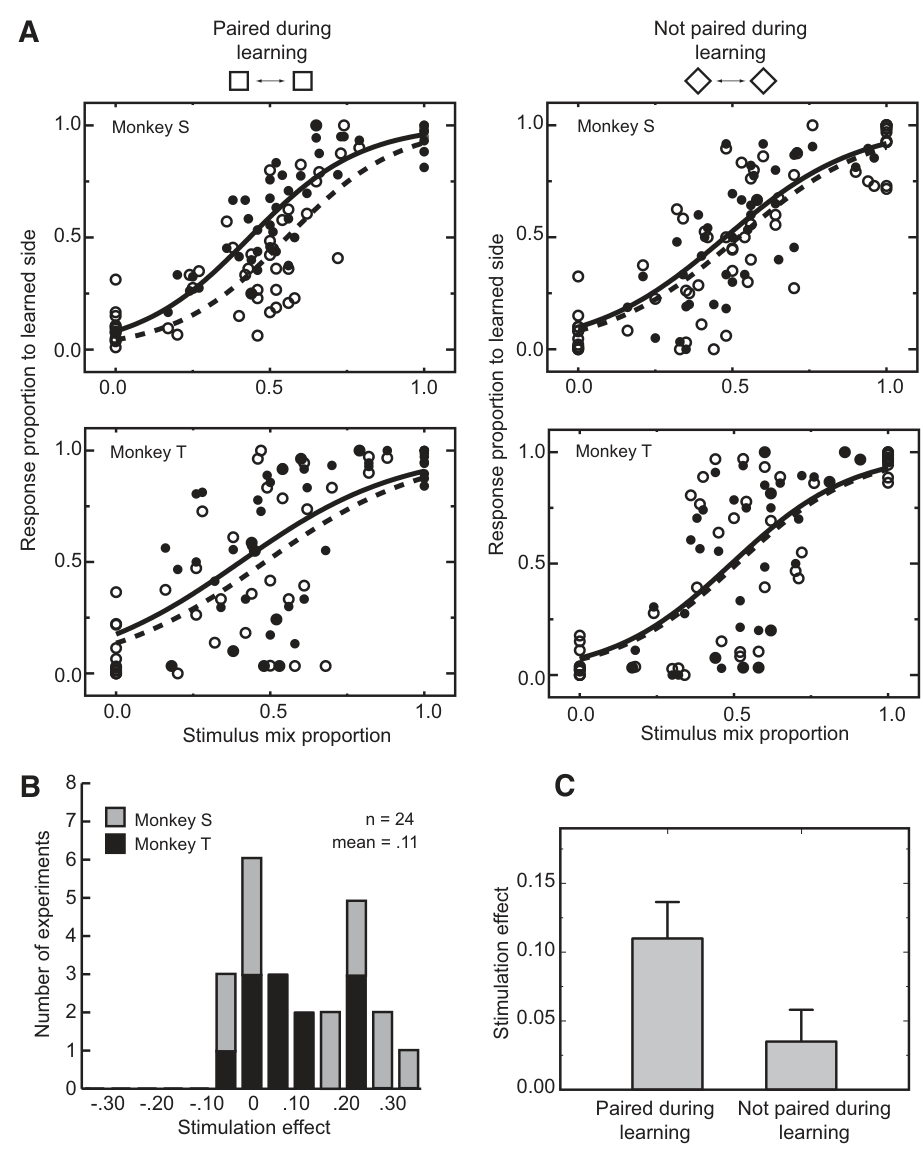
图 8 · 反应时证据:电流影响的是决策时间
原文图注:FIG. 8. Effects of IT microstimulation on reaction times. A: pooled reaction times for ambiguous trials for the response to the stimuli mixture from 1 of which had been previously been associated with microstimulation show that microstimulation affected choice times. Choice reaction times were speeded for stimulated trials in which the monkeys chose the predicted (microstimulation associated) stimulus and were slowed by microstimulation on trials in which the animals chose the unpredicted stimulus (choice × stimulation interaction, monkey S: P < 0.001, monkey T: P < 0.01). Error bars denote 95% confidence intervals. B: pooled reaction times for ambiguous trials in response to the mixtures containing images neither of which had been previously been associated with microstimulation. These data do not show the systematic bias observed for the associated mixtures (choice × stimulation interaction, monkey S: P = 0.2, monkey T: P = 0.1).
解读:A 图展示包含训练配对图案的混合刺激下按键反应时,施加微刺激使选择预测按键的反应时加快,同时显著延缓选择非预测按键的反应时(选择×刺激交互作用在两只猴中均显著)。B 图展示对照混合图案下的反应时,未见系统的调制效应。该时间维度的证据与感知决策中的证据累积模型相符,支持主要结果第 5 条。
讨论
本研究将微刺激技术应用于视觉联合学习过程。与运动区 MT 或体感区 S1 中利用预存调谐偏置即时知觉的经典范式不同,本实验未针对特定图形预选选择性神经元,测试图案对实验动物亦属新异;结果证实 IT 内部未预先分化的神经元群体在接受微刺激后,能与视觉输入共同编码形成新的按键分类联结。这与早期大电流皮层条件反射实验不同:经典实验中强电刺激可直接诱发条件反射且迅速泛化,而本实验中纯刺激无法触发按键,学习严格依赖单次会话中的特定图案组合,且无跨会话加速倾向。在效应幅度方面,混合图形测试中诱发的 11% 偏置与 Afraz 等(2006)在面孔选择区微刺激获得的效果相当,提示非面孔特异的 IT 柱状柱状结构同样具备支持知觉分类的计算效能。
在因果定位边界方面,作者指出“IT 的局部活动足以建立新联结”并不等同于“记忆痕迹即储存在 IT 本地”;实验证明了人工注入的电信号能与 IT 内部的视觉诱发响应发生功能交互,但该联合信号随后可能经由额—颞投射、颞—纹状体环路或内侧边缘系统形成长程可塑性改变。此外,单次会话内能迅速建立映射而缺乏跨会话渐进优化的特点,亦提示长时程分类决策的巩固可能依赖更广泛的下游脑区。未来的研究需结合细胞类型特异的光遗传学等手段,进一步精细解析此类皮层人工活动与行为决策间的因果交互网络。
一句话总结
该研究通过严格的实验逻辑排除了多重替代解释:纯刺激试次失败排除了直接的电刺激—按键运动反射绑定,相对时序学习排除了单纯存在检测,邻近听觉区阴性对照排除了非特异皮层电流假象,而混合图形的特异偏置排除了泛发运动偏好。实验因果证实了人为注入的 IT 活动可作为联结学习的有效信号;同时,单次会话内学习迅速而跨会话缺乏渐进式优化的现象提示,长程视觉分类联结的巩固可能涉及更下游的额叶或纹状体环路,作者在讨论中亦对该定位边界作出了客观阐明。