本文探讨了计算神经科学中关于“稀疏、去相关编码必然最有效”的经典假说。作者在轻度神经安定麻醉的猕猴外侧下颞叶(IT)皮层植入跨越约两个皮层柱的 64 位点高密度多层微电极阵列,系统测定局部神经元的放电相关结构、调谐稀疏性及其跨皮层层状分布。研究发现,群体中少数“合唱者”神经元(choristers,指在静息与刺激状态下均表现出高调谐相关性的细胞)相较于高度异质的“独唱者”(soloists),携带了泛化能力更强的物体类别信息;这些合唱者特异性富集于皮层输出层(第 2/3 层与第 5/6 层),而在输入层(第 4 层)极其罕见;且神经元的相关强度与表征调谐锐度(经典稀疏性)基本解耦。进一步地,由该相关结构提取的“神经定义特征”能够精准预测人类在复杂视觉搜索任务中的行为反应时,为理解高级视皮层低维关联结构支持高效泛化提供了实验支持。
研究背景
在计算神经科学中,高效感官表征理论长期将“稀疏编码”(sparse coding)与“消除冗余”(redundancy reduction)视作信息传递的基本准则。直觉上,降低神经元之间的响应相关性可以减少冗余信息的重复传递,使有限的神经带宽在信息论意义上最大化其香农信道容量;稀疏与去相关因此被广泛推测是感觉皮层演化的关键优化目标。
然而,在实验神经生理学中,“稀疏性”与“冗余度”的概念内涵往往被概念性混淆。绝大多数实验文献中所测定的“寿命稀疏性”(lifetime sparseness),实质上衡量的是单个神经元在一组测试图片上的刺激选择性调谐锐度(tuning sharpness),并不直接等同于瞬态群体水平上的动作电位冗余度;神经元即使各自调谐尖锐,若其活动高度同步共变,群体表征依然可以是冗余的。相反,若神经系统需要实现跨越视角、尺寸和背景干扰的稳定不变性识别,过于孤立或去相关的特征反而可能缺乏泛化能力;过度追求去相关甚至可能将具有生理共变特性的有效信号视同噪声滤除。
为了澄清调谐锐度、群体相关结构与表征泛化能力之间的真实关系,必须在同一批神经元中同步测量相关强度与稀疏性,并解析其沿皮层垂直深度的微回路分布。既往常规单微电极记录无法获得空间临近单元的精细相关阵列,而宏观成像又缺乏层状单细胞分辨率。本研究借助跨越皮层垂直深度的高密度微电极阵列,在猕猴 IT 皮层直接对比高相关“合唱者”与低相关“独唱者”的功能差异,并检验其能否映射至宏观视觉搜索行为。需客观指出的是:本研究主要基于轻度麻醉猕猴的电生理数据开展二次深度分析,清醒自由行为下的注意力调节可能对相关矩阵带来瞬态调制;阵列采样局限于外侧 IT 皮层约两个柱的局部空间,结论向全颞叶的推广仍需保持审慎。
研究思路
研究设计遵循“概念解耦 → 解剖层状定位 → 生物计算建模 → 人类行为映射”的递进路线。首先在概念与统计上将单个细胞的“调谐锐度(稀疏性)”与细胞对之间的“调谐相关强度(群体冗余度)”明确区分为两个正交维度,并在同一组神经记录中直接检验两者的相关性,以排除“相关强等同于调谐宽”的潜在质疑;同时通过严格匹配视觉驱动强度与电极物理间距(≥600 µm),排除单神经元重复检出与单纯激活水平差异的平凡假象。
其次,利用高密度探针在皮层垂直深度上的连续电极排布,统计高相关合唱者与低相关独唱者在不同解剖皮层深度(特别是第 4 输入层对比第 2/3 浅层及第 5/6 深层)的分布偏好,结合主成分分析(PCA)量化低维相关流形在不同皮层深度的方差解释率。
最后,基于该相关流形推导出“神经定义特征”(neurally defined features):利用阵列前两个主成分的得分极端值筛选出具有明确生物学调谐取向的测试物体;并以此构建人类视觉搜索任务(目标与干扰物分别对应相同主成分、相反极性或不相关阵列),检验源自猕猴 IT 皮层微回路相关结构的特征是否直接决定了人类视觉注意力搜索的易度。
方法
实验数据源自 4 只成年恒河猴在轻度神经安定麻醉状态下的外侧下颞叶皮层(A16 附近)电生理记录。采用高密度多触点线性微电极阵列(总计 64 个位点,水平跨越约 2 个皮层功能柱,垂直深度覆盖 0.2 至 1.6 mm)。记录在快速串行视觉呈现(RSVP)范式下完成(图像呈现 94 ms,间隔 106 ms,频率 5 Hz,每种刺激重复 10 次),提取刺激后 100 至 200 ms 时窗内的平均尖峰发放率。刺激材料包含两套独立的测试图集:刺激集 1 包含 240 张灰度三维渲染物体,刺激集 2 包含 113 张彩色、灰度与剪影真实照片。
数据分析方法: - 调谐相关强度(tuning correlation):计算各记录位点与同阵列内所有其他位点在刺激响应向量上的平均皮尔逊相关系数 r;将每阵列中平均相关强度最高的前 30% 位点定义为“合唱者”(choristers),其余定义为“独唱者”(soloists)。 - 稀疏性:采用经典的 Rolls-Tovee 寿命稀疏性指数评估单个位点的调谐宽度。 - 解码泛化测试:随机抽取 2 个物理间距 ≥600 µm 的位点,在控制视觉驱动强度前提下,利用最近邻分类器测试对未训练样本的类内跨视角泛化解码能力。 - 空间层状分析:依据电极深度分为 0.2 mm、0.4 mm 直至 1.4 mm 以上等不同深度区间,利用主成分分析(PCA)量化前两个主成分(PC1、PC2)解释的响应方差比例。 - 人类行为心理物理实验:招募多名健康受试者,在短时呈现掩蔽视觉搜索任务中(搜索屏呈现 34–136 ms 后接掩模),寻找由神经定义特征构成的目标物体,记录其四选一按键反应时与错误率。
主要结果
- 群体相关强度与单个细胞稀疏性基本解耦(图 2A):在全部 250 个记录位点上,调谐相关强度与调谐稀疏性(锐度)之间仅存在极其微弱的相关(总体 r = −0.09,p = 0.04;在 5 个电极阵列内部各自均未达统计显著);而在两个完全独立的刺激集测试中,位点的平均相关强度(r = 0.70,p < 10⁻³⁹)与稀疏性(r = 0.72,p < 10⁻³⁷)各自均表现出高度的可重复性与稳定性。该结果排除了由于测量噪声导致相关性微弱的假说,证实群体相关与个体稀疏是两个正交的功能维度。
- 合唱者神经元携带泛化能力更强的物体类别表征(图 2B–D):在物理间距相距 ≥600 µm 且严格匹配单细胞视觉驱动反应的前提下,仅使用 2 个合唱者位点的组合,其类内跨条件泛化解码准确率即显著优于 2 个独唱者位点的组合(图 2B);合唱者之间的噪声相关(Rsc)显著高于独唱者(0.13 对 0.04,图 2C);而直接依据调谐稀疏性(宽调谐对比尖锐调谐)分组时,两组的泛化解码性能完全没有统计差异(图 2D)。
- 合唱者神经元特异性富集于皮层输出层(图 3、4):皮层垂直深度分析显示,合唱者在皮层第 4 输入层(深度 1.0–1.2 mm)几乎完全缺失,而是高度富集于表层第 2/3 层与深层第 5/6 层等皮层输出层(图 3A、B);与之相对,按调谐稀疏性分组时,宽调谐与窄调谐位点在各皮层深度呈现完全均匀的分布(图 3C、D)。主成分分析表明,输出层位点的响应模式被前两个主成分(PC1 与 PC2)高度解释(解释方差达 40%–50% 以上),而输入层(1.2 mm)位点的低维解释方差显著较低(图 4D、E)。
- 基于相关结构定义的神经特征精准预测人类视觉搜索表现(图 5–7):利用阵列前两个 PC 的激活极端值提取的“神经定义特征”,在视觉搜索实验中构建出具有明确神经物理意义的刺激组。人类行为测试表明:当目标与干扰物属于同一阵列主成分相反极性时(“Opposite”条件,神经表征差异最大),人类搜索表现出显著的平行搜索特征(反应时随干扰物数量增加仅以 4.5 ms/item 缓慢上升);而当两者属于同一主成分不同分支时(“Related”条件),搜索转为串行搜索(斜率上升至 14.5 ms/item,错误率达 25%)(图 7),证实局部皮层低维相关流形直接映射了知觉注意的宏观几何。
图注解读
图 1 · 实验设计与毛根模型
原文图注:FIGURE 1 | Experimental design and "pipe cleaner" model. (A) We inserted a dense multi-depth array (64 sites across ∼2 cortical columns) in macaque lateral IT (A16) and recorded spiking responses under light neurolept anesthesia. Stimuli were presented via rapid serial visual presentation, for 94 ms ON and 106 ms OFF (5 Hz), in pseudorandom order for 10 repetitions. Spike count from 100 to 200 ms post stimulus onset was averaged across repetitions. (B) A "pipe cleaner" model linking local correlational structure in neighboring columns to invariant representation. Most neurons are weakly correlated "soloists" (the bristles), tied to an underlying structure of correlated neurons ("choristers", the spine). Sampling a few points along the spine (a few choristers) is sufficient to reconstruct the overall structure. The model predicts that generalizable object information is carried by the choristers, and that the heterogeneity of the soloists may help to fine-tune the choristers to support generalization.
读图要点:(A) 展示实验记录与刺激呈现的参数配置:外侧 IT 皮层植入 64 位点多触点高密度阵列,轻度麻醉状态下采用 5 Hz 的 RSVP 呈现范式(呈现 94 ms,间隔 106 ms),提取刺激后 100–200 ms 时窗内的动作电位计数。(B) 给出核心概念模型(毛刷模型):离散的鬃毛代表输入端高度异质但互不相关的神经元(独唱者),中轴骨架代表高相关、彼此协同的神经元核心(合唱者);沿中轴骨架抽取少数几个合唱者采样点,即可有效重构该皮层柱的主要功能表征。该模型解释了少数合唱者承载主要泛化解码能力的机制,并对皮层层状分布作出了理论预测。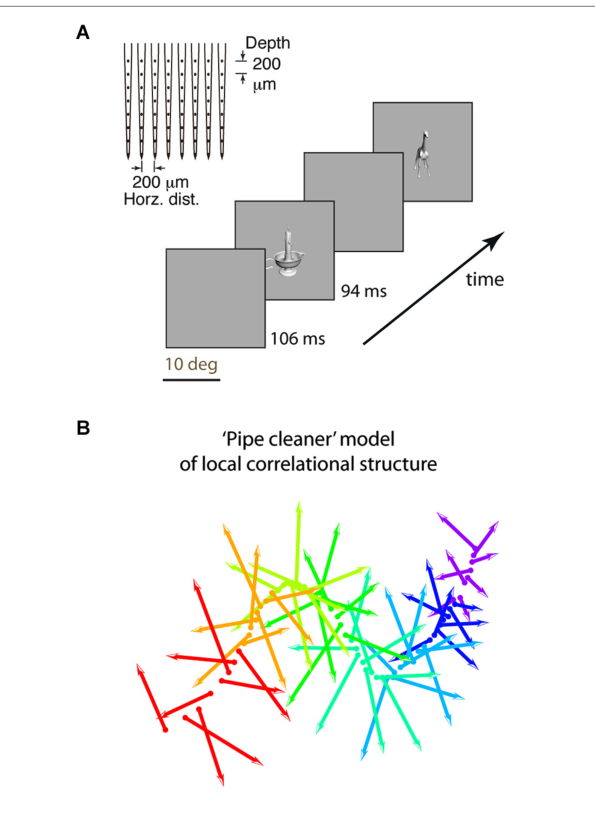
图 2 · 相关结构、稀疏性与泛化解码
原文图注:FIGURE 2 | Local correlational structure, sparseness, and generalization performance. (A) Sparseness (tuning width) and average correlation strength were only weakly related across 250 sites in anesthetized IT (r = −0.09, p = 0.04). Sparseness and average correlation strength were each highly consistent across two stimulus sets (r = 0.72 and 0.70, p < 10−37 and p < 10−39 resp.). Choristers (brown) are the 30%ile of sites with the highest average correlation strength per array, and soloists (black) are the remaining sites. (B) Visual responsiveness vs. within-category generalization performance for choristers (top 30%ile, brown) vs. soloists (45–65%ile, red), for 2 sites per array, with at least 600 µm horizontal distance between sites. Visual responsiveness was calculated as the evoked (baseline-subtracted) response to each site's preferred object, shown as the median across 10 sites (2 sites per array, 5 array insertions across 4 monkeys). Chance is 12.5% for 8 categories, and ceiling performance is based on all sites. (C) Noise correlation (Rsc) of choristers vs. soloists ... (D) Same analysis based on sparseness (tuning sharpness). Average sparseness of broadly tuned and sharply tuned (sparse) sites were 0.12 ± 0.08 and 0.69 ± 0.25, resp.
读图要点:(A) 展示平均调谐相关强度(纵轴)与调谐稀疏性(横轴)在 250 个位点上的散点分布,数据显示二者无明显相关趋势(r = −0.09,p = 0.04);(B) 展示类内跨条件泛化解码准确率,棕色点(合唱者)在严格控制视觉驱动匹配及 ≥600 µm 物理间距的前提下,解码表现显著优于红色点(独唱者),排除了电极串扰与单纯放电率偏置的平凡假象;(C) 对比两者之间的逐试次噪声相关(Rsc),合唱者组(0.13)显著高于独唱者组(0.04);(D) 展示按调谐锐度(稀疏性)高低分组开展相同解码测试的结果,两组在泛化准确率上完全无统计学差异。该图确立了相关结构与个体稀疏性的概念解耦,支撑结果 1 与结果 2。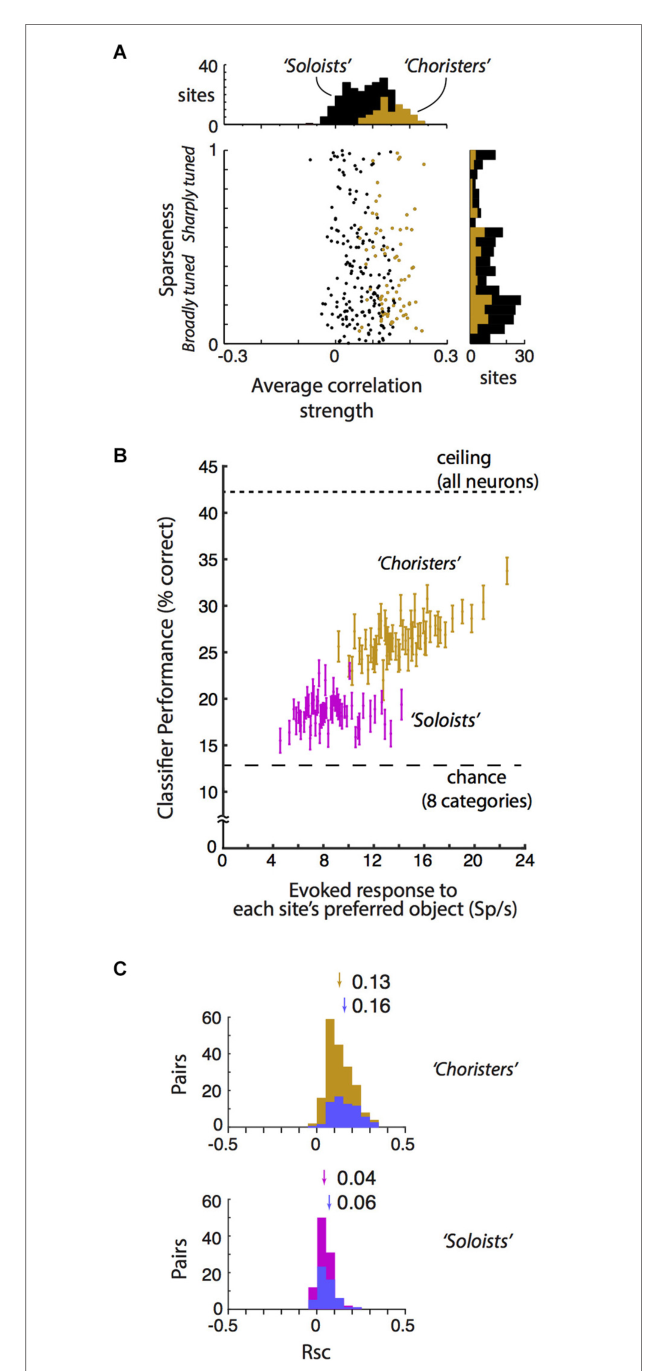
图 3 · 皮层深度与相关强度/稀疏性
原文图注:FIGURE 3 | Cortical depth vs. correlation strength and sparseness. (A,B) We sorted sites by their average strength of tuning correlation with other sites in the same array, then grouped the top ∼30% of sites per array as "choristers" and the bottom ∼30% as "soloists". Choristers are rarer in layer 4 (1.0–1.2 mm depth), whereas soloists are more common at 0.2 and 1.2 mm depth. The number of sites selected per group was higher for arrays 1–3 (16 choristers and 16 soloists per array) than for arrays 4 and 5 (8 choristers/soloists per array), because arrays 4 and 5 had fewer active channels. Average correlation strengths of choristers and soloists were 0.15 ± 0.04 and 0.02 ± 0.03, resp. (C,D) Same analysis based on sparseness (tuning sharpness). Average sparseness of broadly tuned and sharply tuned (sparse) sites were 0.12 ± 0.08 and 0.69 ± 0.25, resp.
读图要点:以 0.2 mm 为步长系统统计合唱者与独唱者在不同皮层垂直深度(0.2 mm 至 1.2 mm 以上)中的分布频率:(A) 与 (B) 显示合唱者在第 4 输入层(1.0–1.2 mm)几乎完全缺失,而独唱者在 0.2 mm 浅层与 1.2 mm 输入层显著富集;(C) 与 (D) 展示按调谐锐度(稀疏性)划分的高、低两组在各深度上的分布统计,未表现出任何层状解剖偏好。该对比确立了层状特异性属于群体相关结构而非调谐锐度本身,支撑结果 3。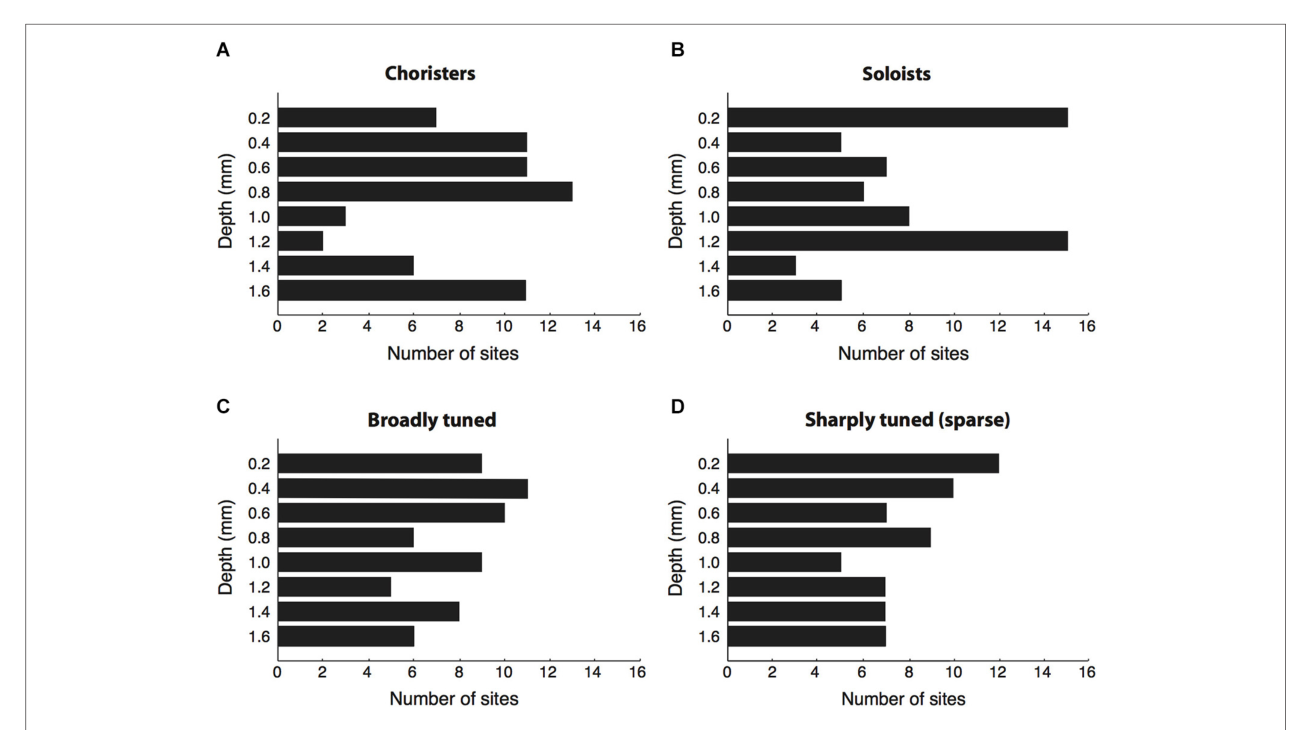
图 4 · 皮层深度与低维相关结构
原文图注:FIGURE 4 | Cortical depth vs. low-dimensional correlational structure. (A) Percent of response variance explained by PCs 1–5, based on z-normalized responses. Chance and 5–95%ile distributions are indicated by open circles and red bars, based on shuffling of response IDs across trials. (B,C) Explained variance for Arrays 2 and 3, from two separate array insertions (separate recording sessions) in monkey 2. (D) Cortical depth vs. percent explained variance of PCs 1 and 2 across 5 arrays. (E) Comparison of distributions in (D) among different depths. p < 0.05, p < 0.01, **p < 0.001, •p = n.s.
读图要点:(A) 给出前 5 个主成分解释神经响应方差的百分比与置乱对照水准;(B) 与 (C) 展示两个代表性阵列在皮层空间网格上的前两主成分解释方差(%EV)热图,显示输出层位点的响应能被低维主成分高效解释;(D) 与 (E) 汇总 5 个记录阵列,按皮层垂直深度定量对比 %EV 分布,证实 1.2 mm 输入层与 0.2 mm 浅层的低维解释方差显著偏低。该图将层状特异性推进至低维流形几何层面,支撑结果 4。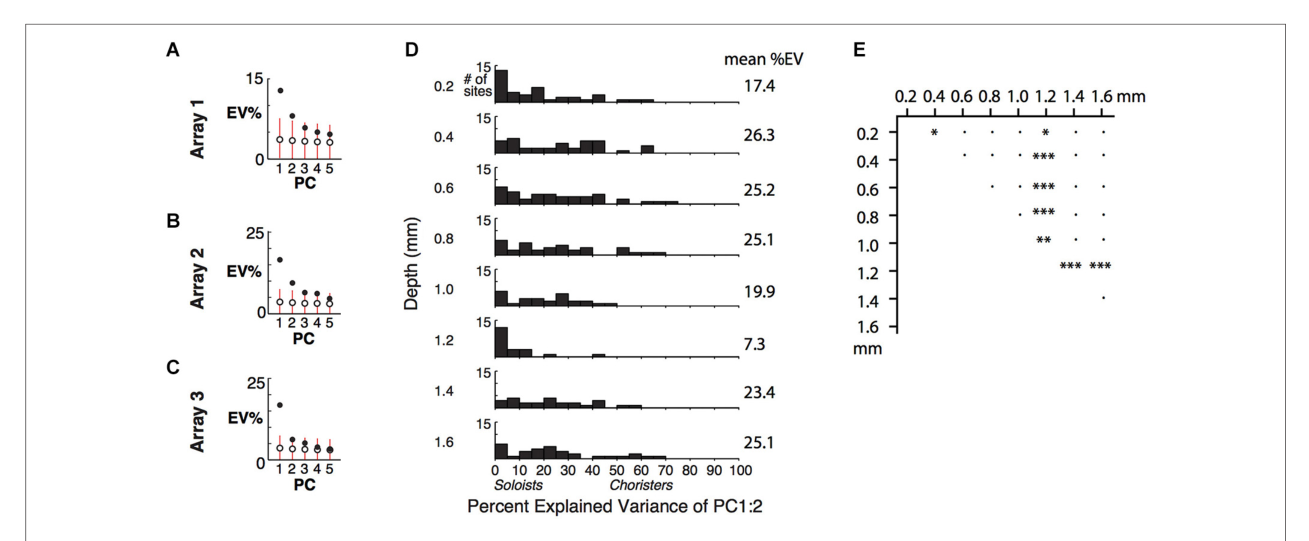
图 5 · 神经定义特征长什么样
原文图注:FIGURE 5 | Neurally defined features. (A) Neurally defined features based on Array 1's PC1 and PC2 scores. Each red and blue 8 × 8 matrix shows baseline-subtracted response to one stimulus across the 64 sites, spanning all depths and neighboring IT columns. PC1+ stimuli activated most sites. PC2+ and PC2− stimuli differentially activated sites on the right and left sides of the array. Numbers indicate stimulus IDs. Black dots in stimulus 19's matrix indicate inactive sites. Red lines indicate 5–95%ile, and filled circles indicate stimuli with significant PC2. "Protrusions" and "Internal Features" are labels to help see the pattern of PC2− and PC2+ stimuli, but the labels are not part of the feature definition. (B) Features from 3 array insertions (3 recording sessions) in two monkeys and two stimulus sets. Only the stimuli with the most extreme scores are shown, out of 240 object stimuli for set 1 (grayscale rendered 3D objects) and 113 stimuli for set 2 (color, grayscale, and silhouette photographs).
读图要点:(A) 中每个 8×8 颜色矩阵展示单个刺激在 64 个阵列记录位点上的诱发反应模式(基线扣除),PC1+ 刺激引起全阵列广泛响应,而 PC2+ 与 PC2− 刺激分别选择性激活阵列左、右两侧的不同功能柱(文字标签“突起/内部特征”仅为视觉直观辅助,特征严格基于 PCA 得分量化界定);(B) 展示依据主成分得分极端值挑选的代表性物体刺激样本。该图建立了由神经相关流形映射至心理物理测试材料的方法桥梁,支撑结果 4 的刺激构建。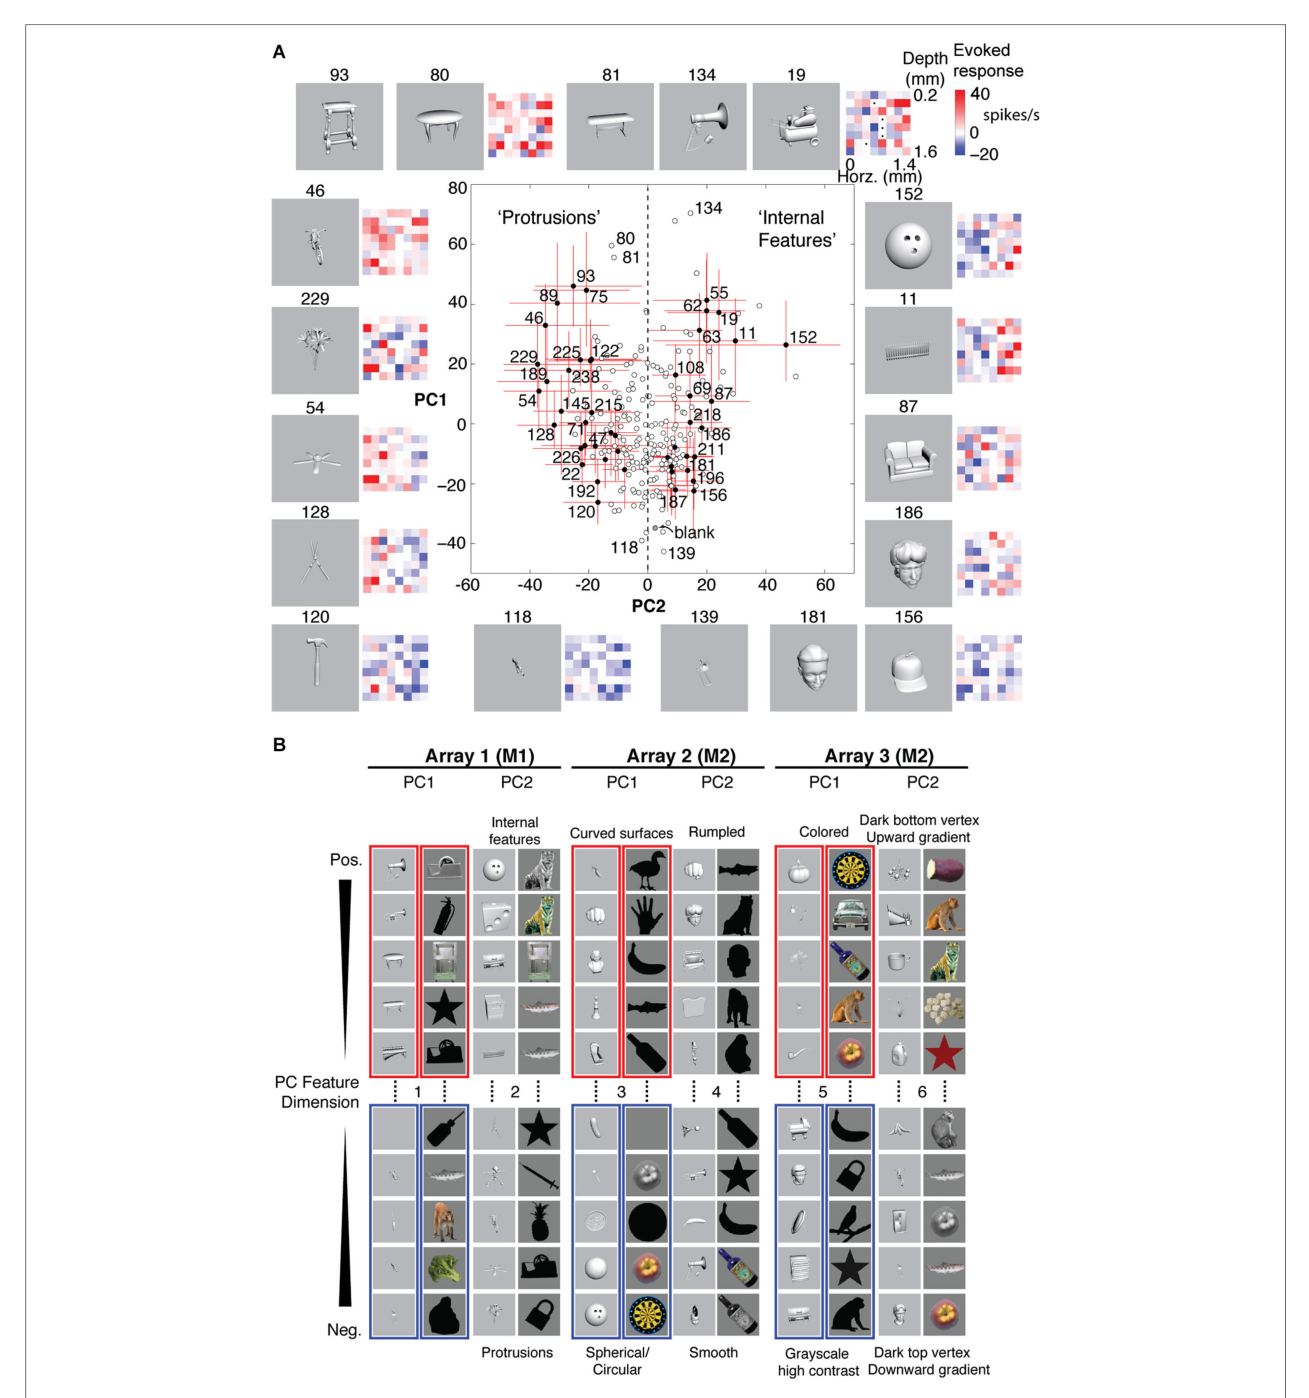
图 6 · 基于神经定义特征的视觉搜索任务
原文图注:FIGURE 6 | Visual search task based on neurally defined features. (A) "Related", "Opposite", and "Unrelated" conditions are tied to the differential activation of overlapping, neighboring, and distant IT columns by neurally defined features. In each condition, the target objects belong to one feature (e.g., Array 2 PC2+) and the distractor and background objects are disjoint sets belonging to the other feature (e.g., Array 2 PC2−). "Related" features are from different PCs of the same array. "Opposite" features are from opposite signs of the same PC of the same array. "Unrelated" features are from different arrays. (B) Time course of each trial. Following Fixation screen and Adapting Background (0–8 s), Target and Distractors appeared for 34–136 ms, followed by a Mask with tile-scrambled background images. After disappearance of the fixation point, subjects reported via keypress the target quadrant. (C) Each trial consisted of one target and 3 distractors at four possible locations. Objects and target locations were balanced across all conditions. (D) Example stimulus from "opposite" condition, with target in quadrant 4.
(A) 定义三种条件的皮层几何含义:opposite=同一 PC 的相反极性(相邻柱差分)、related=同阵列不同 PC(同一柱的不同尺度)、unrelated=不同阵列(相距 >3 mm 的柱);(B) 给出试次时序(注视→适应背景 0–8 s→目标组 34–136 ms→掩蔽→按键报告象限);(D) 是 opposite 条件的实际画面示例。三种条件把"皮层邻近性"变成了实验自变量,支撑结果第 5 条的设计逻辑。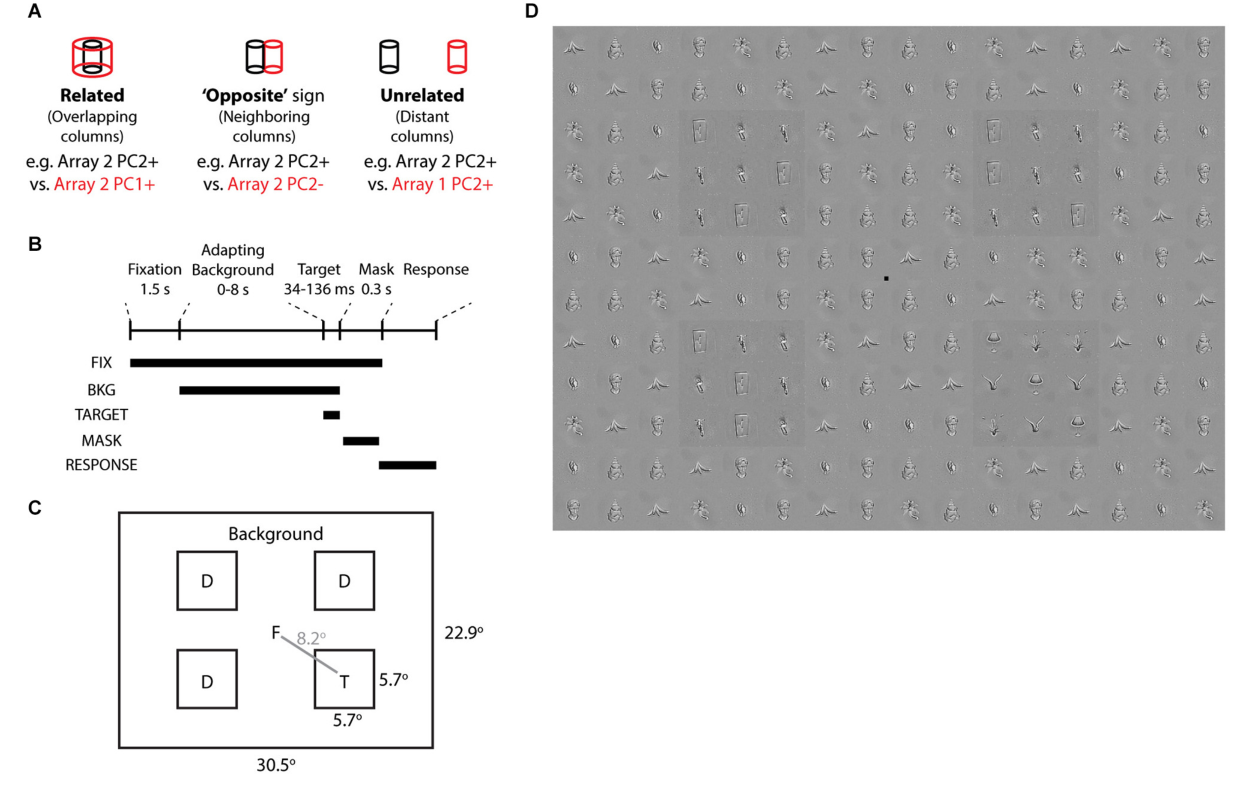
图 7 · 神经定义特征的视觉搜索表现
原文图注:FIGURE 7 | Visual search performance for neurally defined features. (A) Performance of one subject for target whose neurally defined feature is "opposite" (blue) or "related" (red) to that of the distractors and background, across different adaptations and different stimulus onset asynchrony (SOA) between stimulus and mask. Accuracy is higher for "opposite" at 34 ms SOA, and the difference between "opposite" and "related" is more consistent at longer adaptation. Error bars show 95% CI, based on 48 trials per condition. (B) Performance across 6 subjects at 2 s adaptation and 34 ms SOA for "opposite" (blue), "related" (red), and "unrelated" (green) conditions. Black line indicates average performance across subjects. The difference between "opposite" and "related" is significant at p = 0.03, based on Wilcoxon signed ranks test. (C) Average performance across 6 subjects at 34, 68, and 136 ms SOA, 2 s adaptation.
(A) 单被试的准确率随适应时长与 SOA 变化,蓝色(opposite)在 34 ms SOA 稳定高于红色(related);(B) 6 名被试在 2 s 适应、34 ms SOA 下的个人成绩与均值,opposite 对 related 的差达显著(p=0.03);(C) 显示把 SOA 拉长到 68、136 ms 后组间差异消失。正是"只在最短 SOA 出现"这一点支持了效应来自前馈加工与短程侧向相互作用,而非反馈或长程交互,支撑结果第 5 条。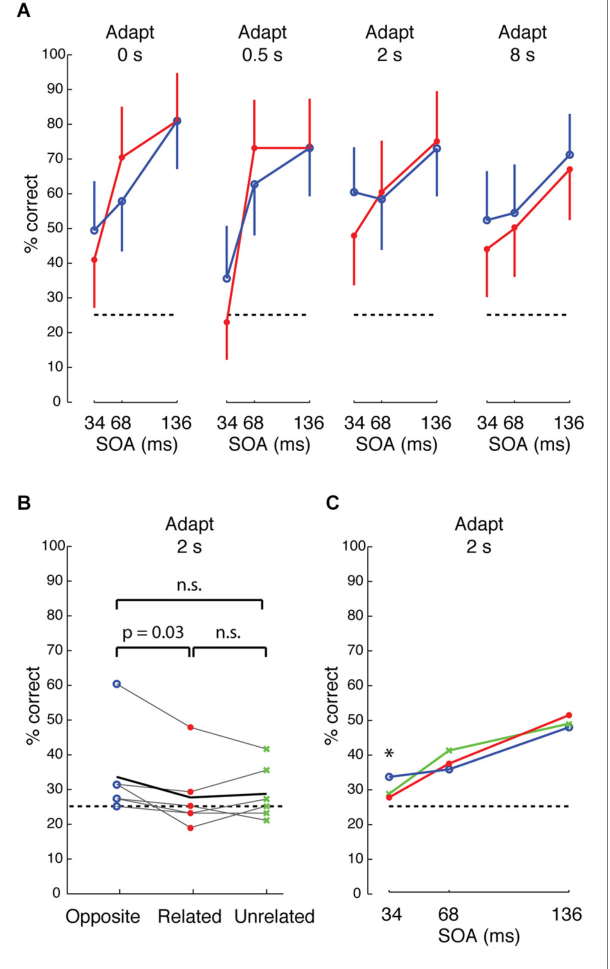
讨论
作者从计算效率与皮层微回路架构两个层面对核心发现进行系统总结: 在信息论与计算原则层面,本研究指出在高级视皮层中,不能简单将“降低相关性”与“提高编码效率”画等号。神经元单体水平上的调谐锐度(稀疏性)与群体响应的相关结构属于完全解耦的两个物理量;真正承载类内跨条件泛化识别能力的,反而是具有较强相关放电的少数合唱者神经元。这一发现与低维流形假说高度吻合:高维物理刺激映射到 IT 皮层后,被规整为少数主成分主导的低维平滑流形;合唱者紧密锚定在该流形的主轴骨架上,能够以极高的信噪比支持下游网络的鲁棒泛化提取。
在皮层解剖层状架构层面,合唱者在输入层(第 4 层)的缺失及其在输出层(第 2/3 层与第 5/6 层)的特异性富集,揭示了皮层微回路内部的计算变换时序:来自上游(如 V4)的输入信号在第 4 层可能保持高度异质且正交的独立状态;在经历局部循环回路与侧向突触整合后,输出层神经元逐步抽取并稳定了低维相关表征,并以此形态向前额叶等下游区域投射。
关于行为映射,基于猴 IT 微回路低维特征构建的刺激能够精准预测人类的视觉搜索效率,证实该低维相关结构构成了灵长类视觉空间显著性的客观物理基础。局限性方面,电生理记录主要在麻醉状态下完成,虽然控制了注意漂移,但清醒任务状态下任务目标驱动的自上而下注意可能动态重塑噪声相关结构,这一动态过程有待后续清醒行为记录进一步验证。
一句话总结
本研究通过高密度微电极阵列记录,证实下颞叶皮层中少数调谐相关的“合唱者”神经元携带了泛化能力更强的物体信息,且特异性富集于皮层输出层;确立了群体相关结构与调谐稀疏性的概念解耦,并证实该局部低维相关结构能够直接预测人类视觉搜索的认知效率。