这篇 fMRI 研究在个体被试内把"工具特异性"活动定位到人脑 IPS 的拓扑分区与运动定义脑区之间:工具特异的 tAIPS 位于 IPS5 之外侧、前侧、下侧,与抓握区 hPGR 并不完全等同。它最有价值的发现是一条沿 IPS 从后到前的反应梯度——可抓握的非工具物体在 IPS 后段与工具同高、与前段持平,说明背侧流对物体的表征从"可抓握的视觉特征"逐级过渡到"经验性用途知识"。
研究背景
腹侧—背侧两条通路的两分中,背侧流最初只与空间认知挂钩,但 Goodale 和 Milner(1992)提出其核心功能是引导针对物体的动作。解剖与影像证据在左半球形成一个与工具关联的网络(前 IPS 及顶下/上小叶),被试看工具图片、听、执行、计划、演示工具使用都会激活它;这套网络受损导致观念运动性失用(ideomotor apraxia)——识别工具尚可、使用动作失败——且单纯看物体图片也能唤起其所afford(可供性,affordance)的动作表征。
另有一条独立脉络:MRI 研究在人 IPS 中发现了一系列具有视野拓扑组织的区域(IPS0–IPS5,由极角图反转分界),构成背侧流高层区域层级,且能在个体被试中逐一划分。Konen 与 Kastner(2008b)报告 IPS1/IPS2 与 LOC(lateral occipital complex,外侧枕叶复合体)一样持有大而旋转不变的基本物体表征。工具相关活动通常落在左前 IPS,与 IPS5 具有解剖邻近性,也猕猴 AIP(前内顶区)。——即本文所称的人顶叶抓握区(hPGR,human parietal grasp region,其他文献称 hAIP)。当时的缺口在于:工具特异区与 IPS5、hPGR 三者到底是什么关系(重叠还是分离)?Valyear 等(2007)已显示工具活动位于 hPGR 之后,不像运动计划;但 IPS5 与工具区是否同一块皮层仍不清楚;此外同种比较中发现猕猴(即使训练用工具)没有功能等价的工具区(Peeters 等 2009),使"人类工具区如何演化而来"成为悬案。
研究思路
作者的策略是"个体内 ROI + 分类层径对照":先用五个独立的功能定位扫描在每个被试皮层表面定义一串解剖上避免交叉的 ROI——拓扑区 IPS0–IPS5 与 SPL1(记忆引导眼跳任务)、运动定义的 hPGR(抓握 vs 伸手)、视觉定义的 tAIPS(工具 vs 动物对比)以及腹侧流的 tPHC、aFF、tMT 和 LOC——再让同一批被试在任务中观看四类刺激(工具、动物、可抓握的非工具物体、打乱图像),提取每个 ROI 的反应剖面。这样做能绕过高阶顶叶区域巨大的个体间解剖变异,避免群体层面的空间标准化抹掉个体边界。
链条上最关键的一环是第三类刺激"可抓握的非工具物体"(皮带、钱包、蜡烛等):如果前 IPS 的活动只是"可抓握性"的视觉特征,它应当像工具一样在全程 IPS 内高于动物基线;如果它是"工具特有的经验—功能知识",则可抓握非工具应当在后段与工具并列、到前段掉回动物水平。d′(可分性指数)的两两对比与跨 IPS0–IPS5 的线性趋势检验使这条梯度可以被定量确认。
方法
12 名右利手、视力正常或矫正至正常的成人(7 男,24–36 岁)。,每人参加 5–6 个扫描 session;多数数据在 Siemens 3T Allegra 采集(工具—动物定位器与其中 3 名被试的类别定位器在 Skyra;主要实验 34 层,TR 2 s)。主实验为块设计:每块 16 s、含 16 张真实照片(每张 750 ms 呈现 + 250 ms ISI),交替呈现仅含注视点的 16 s 空 block;被试在中央注视的同时隐蔽计数注视点变暗次数(注意被主动引导离开图像),共 12 run、每类 24 块,类别顺序完全平衡。
预处理与统计:AFNI/FSL/FreeSurfer/SUMA;切片时间与动头校正、4 mm 平滑、按各自 run 平均强度归一为百分比信号变化;GLM(3dDeconvolve 的 BLOCK 模型)估计每类响应。分析窗为 block 起始后 6 s(3 个 TR)起的 14 s(7 个 TR)平均。拓扑 IPS 0–5 用一个 ROI×刺激类别的二因素重复测量 ANOVA(被试为随机因素),并对其余 ROI 分组(hPGR+tAIPS、腹侧区组、V1、SPL1)各自做同形 ANOVA;两两比较算 d′ = (均₁−均₂)/√((方差₁+方差₂)/2),对 d′ 分布做单样本 t 检验并对 IPS0–IPS5 检验线性梯度;球形破坏用 Greenhouse-Geisser 校正,事后检验用 Dunn-Šidák 校正。tAIPS、hPGR 在分析中分别限定为不与 IPS5 及彼此重叠的部分以保持独立性(图 2 中显示完整范围)。
主要结果
- 工具特异区三区分立:在参加该定位器的 11 名被试中每人都定位出…。或加注说明 S10 未参加。(均值 Talairach x=−41±1.7, y=−38±1.8, z=41±2.0, 体积 8552±987 mm³),位于 IPS5 的外侧、前侧、下侧(X: t(10)=3.59, P=0.005;Y: t(10)=4.79, P=0.0007;Z: t(10) =2.76, P=0.02)以及 hPGR 的外侧、下侧(Z: t(8)=3.55, P=0.008),三者部分重叠但主体分离——IPS5 约有 50% 体素偏工具,但这只约占整个工具特异激活体积的 17%。右半球没有稳定的工具特异区(图 2、表 1–3)。
- 后 IPS 也有工具偏向(新发现):定位器在所有被试的后部拓扑区(如 IPS0)都出现工具 > 动物的偏向,这一后端偏向此前未见报道;主实验的 ROI 时间进程分析确认工具在整个左 IPS 拓扑区都强于可抓握物体(P=0.041)与动物(P=0.002)(图 3、图 4)。SPL1 对三类完好物体无差异;V1 中工具反而反应最弱(工具细长、占据的视网膜面积小),说明高阶区域的工具偏向不是早期视觉区差异的自下而上传播。
- 从后到前的反应剖面梯度:可抓握非工具在 IPS0/1 与工具并列且显著高于动物(P<0.02),到 IPS3–IPS5 掉到与动物持平而显著低于工具(P<0.02);两条两两对比(工具—可抓握:左 F(1,1)=24.16;可抓握—动物:左 F(1,1)=26.76)沿 IPS0–IPS5 的线性趋势在左右两半球都显著。梯度在左半球最强,右半球也有迹象(IPS5 工具 > 可抓握,P=0.007)(图 3B、图 5B/5C)。
- tAIPS 对工具特异、不等于"非生物物体效应":对 hPGR+tAIPS 的二因素 ANOVA 显示类别主效应显著(F(1,2)=15.66, P<0.001),ROI×类别交互不显著(P=0.57)。,事后检验显示工具 > 可抓握(P=0.003)与动物(P=0.006)——即仅观看工具照片(无任何运动要求与动作准备指令)就足以驱动;tAIPS 与 hPGR 剖面相似但 hPGR 略弱(仅工具 > 动物 P=0.04 显著),两区两两比较的差异不显著(工具—动物 t(8)=1.32, P=0.22;工具—可抓握 t(8)=2.03, P=0.077)(图 5A/5B)。
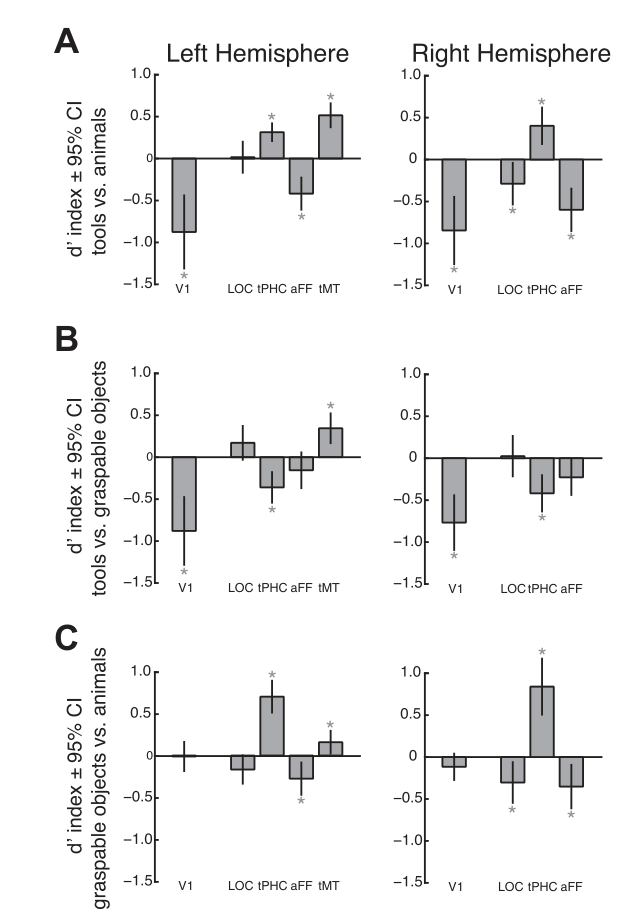
- 腹侧流对照印证特异性:tPHC(双侧海马旁)工具 > 动物且可抓握 > 两者;aFF(双侧梭状回)动物 > 工具/可抓握;与可抓握(P=0.002)。,确认这些区域是"工具"而非"非生物"效应;LOC 在左半球三类完好物体间无显著差异(右半球反而动物强于工具)(图 4、图 6)。
图注解读
图 1 · 定位器与主实验的设计
原文图注:Fig. 1. Schematics of the experimental design for the tool-animal localizer and the main experiment. In the tool-animal localizer (A), subjects passively viewed images of tools (T; e.g., saw, scissors, pizza cutter) and animals (A; e.g., dog, giraffe, polar bear) presented in alternating 16-s blocks. The analysis of this data set is presented in Fig. 2 and used to define a tool-specific functional region of interest (ROI) in the left anterior intraparietal sulcus (IPS) referred to as tAIPS. In the main experiment (B), subjects performed a fixation dimming detection task while images of tools, animals, graspable (non-tool) objects (G; e.g., belt, wallet, candle), and scrambled objects (S) were presented in 16-s blocks, interleaved with fixation-only blocks. The response profile across the 4 stimulus categories was analyzed for a series of functionally defined ROIs, presented in Figs. 3–6. Images in both experiments were realistic photo objects.
A 是定位器时间线:工具块与动物块 16 s 交替、被动观看,其工具 > 动物对比用来定义 tAIPS;B 是主实验时间线:工具 T、动物 A、可抓握 G、打乱 S 四类块交替穿插注视块,任务只要求检出注视点变暗。读图时注意两个范例类别(锯子/剪刀/披萨刀 vs 狗/长颈鹿/北极熊),以及两点设计意图:主实验类别顺序完全平衡、动作要求为零——后面所有的"特异性"结论都建立在"看照片即可"之上。
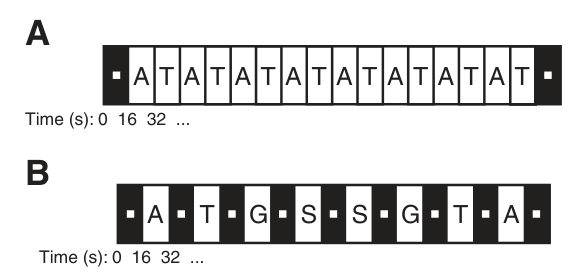
图 2 · 三名代表被试的工具—动物统计参数图
原文图注:Fig. 2. Statistical parametric maps from the analysis of the tool-animal localizer for 3 representative subjects (S6, S9, and S4). Greater responses to images of tools (orange) or animals (blue) are presented on inflated cortical surfaces for each subject (P ≤ 0.01). Asterisks denote the significance peak of the contrast. Topographic regions of the IPS are outlined in black (IPS0–IPS5, posterior to anterior), and the human parietal grasp region (hPGR) is outlined in white. Although the extent of activation varied across subjects, there was a consistent tool-specific region located in the left anterior IPS, extending lateral, anterior, and inferior to IPS5 and lateral and inferior to hPGR. In addition, all subjects showed a response bias for tool images in more posterior topographic regions of the IPS (e.g., IPS0). No consistent response patterns were observed in the right hemisphere.
橙色为工具更强、蓝色为动物更强的体素,画在各被试的展开皮层上,黑色轮廓为 IPS0–IPS5、白色为 hPGR,星号标对比峰。每位被试的激活范围不同,但左前 IPS 内都有一块位于 IPS5 外、前、下的工具偏区;且在例如 IPS0 的后端也赋有工具偏向。这是"每位被试内定位、不依赖模板脑"这一方法的结果展示——也解释了为何 tAIPS 的坐标均值(表 1)看似与 IPS5/hPGR 很近,但三区在同一被试内是分别可辨的。
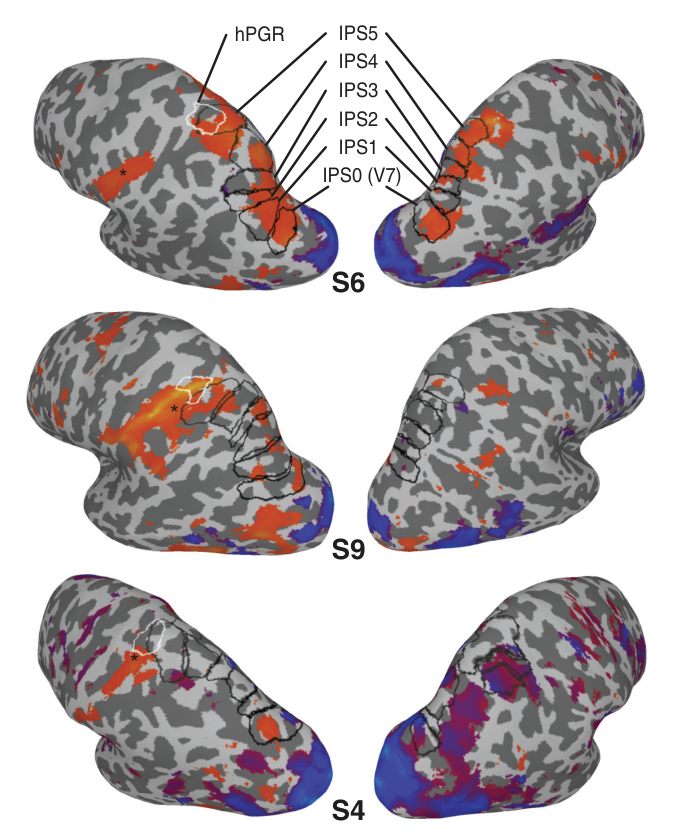
图 3 · 代表 ROI 的平均 BOLD 时间进程
原文图注:Fig. 3. Group-averaged time courses for visually responsive voxels in some representative ROIs of the left (A) and right hemispheres (B). Primary visual cortex (V1) displayed the weakest response to images of tools and the strongest response to scrambled images, indicating its sensitivity to retinotopic image size. Lateral occipital complex (LOC) showed only slight differences in evoked response across the intact stimulus categories. In the IPS, viewing images of tools generally evoked the strongest activity. Additionally, the activity evoked by tools was similar to that evoked by graspable (non-tool) objects and greater than that evoked by animals in the more posterior IPS1, where it exceeded that evoked by both graspable objects and animals in the more anterior IPS5. Grasp, graspable objects; scramb, scrambled objects.
左列为左半球、右列为右半球,每行一个 ROI,横轴为相对 block 起始的时间(s)、纵轴为百分比信号变化,四条曲线是四类刺激。V1 中工具最低、打乱图像最高(视网膜覆盖面积效应);LOC 中三类完好物体几乎并齐;IPS1 中工具≈可抓握 > 动物,IPS5 中工具 > 可抓握≈动物——同一条反应剖面梯度在一图内左右对照可以直观看出来。这张图是结果 2 与 3 的定性版,统计检验在图 5。
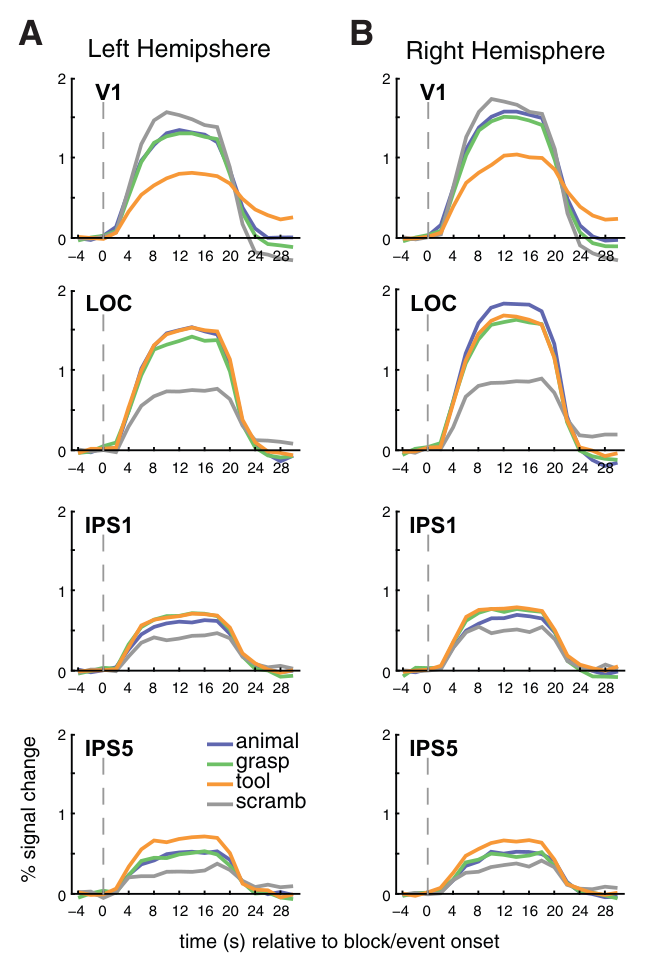
图 4 · 各 ROI 的平均信号变化
原文图注:Fig. 4. Mean signal change separated by stimulus category for each functionally defined ROI in the left (A) and right hemispheres (B). Tools evoked a stronger blood oxygen level-dependent (BOLD) response than graspable (non-tool) objects or animals in topographic regions of the IPS, with more consistent differences in the left hemisphere. A similar pattern was observed in the functionally defined regions hPGR and tAIPS in the left hemisphere. In occipital-temporal cortex, functionally defined ROIs showed response patterns consistent with their definitions from the tool-animal localizer. Tools evoked the lowest response in primary visual cortex, indicating that differences in higher order areas were not simply propagated from early visual cortex. No significant differences across intact stimulus categories were observed for superior parietal lobe (SPL1). †P ≤ 0.001, significant main effect across the 3 intact stimulus categories (S). ‡P ≤ 0.001, significant main effect across ROIs (R). *P ≤ 0.001, significant interaction between stimulus category and ROI (R×S). aFF, animal-specific region near the fusiform gyrus; tMT, tool-specific region in the left middle temporal gyrus; tPHC, tool-specific region near the parahippocampal cortex; n.s., not significantly different.
A/B 分别是左、右半球的柱状图:每个 ROI 四根柱(动物、可抓握、工具、打乱),纵轴为平均信号变化 ±95% CI;星号体系标 ANOVA 的主效应(类别 S、ROI R)与交互项(R×S)的显著性。读图主线:左半球 IPS 拓扑区从后到前,工具柱一致最高,可抓握柱从后端的"跟工具并列"滑向前端的"跟动物并列"——不再平行而呈剪刀状收敛;SPL1 的柱几乎等高。腹侧流 tPHC/tMT 的模式则与各自定义一致。此图汇总主要实验中最直观的观感,统计梯度化数值在图 5。
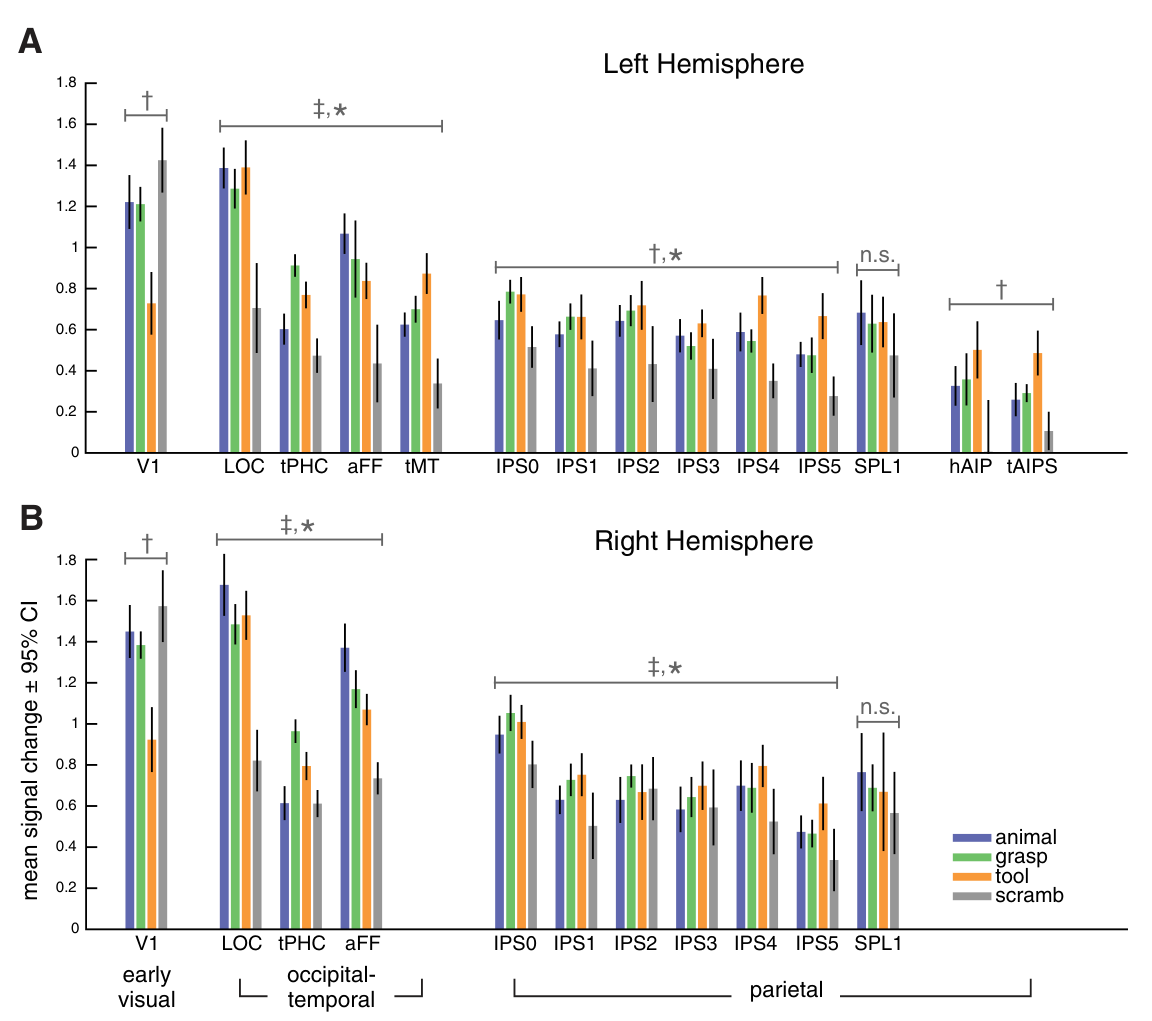
图 5 · 顶叶 ROI 的两两 d′ 对比
原文图注:Fig. 5. Pairwise comparisons of the differences between mean activation evoked by the 3 intact stimulus categories using a d′ index for parietal cortex ROIs. The d′ index is a measure of the separability of the distributions, across subjects, of evoked responses for 2 different stimulus categories. The comparison of tools and animals (A) confirmed the general tool bias in the topographic regions of the parietal cortex, as well as hPGR and tAIPS. The comparisons of tools and graspable objects (B) and graspable objects and animals (C) revealed a response profile gradient along the posterior-to-anterior extent of the topographic regions of the IPS, most clearly in the left hemisphere. Graspable objects evoked significantly stronger response than animals, but not tools, in posterior regions and significantly weaker responses than tools, but not animals, in anterior regions. *P ≤ 0.05, significantly different from zero. †P ≤ 0.003, significant linear trend across ROIs. CI, confidence interval.
横轴沿 IPS0→IPS5 再加 hPGR、tAIPS,纵轴为 d′ ± 95% CI;柱在零线以上表示左类刺激反应分布高于右类。A:工具 vs 动物,左半球各拓扑区与 tAIPS 都显著为正(工具占优);B:工具 vs 可抓握,柱从后端的≈0(无差异)变为前端的显著正(工具胜出);C:可抓握 vs 动物,柱从后端的显著正掉到前端的≈0。B 与 C 的"背向剪刀"合起来就是那条后→前梯度的定量形态,是本文最核心的一张统计图,对应结果 3。
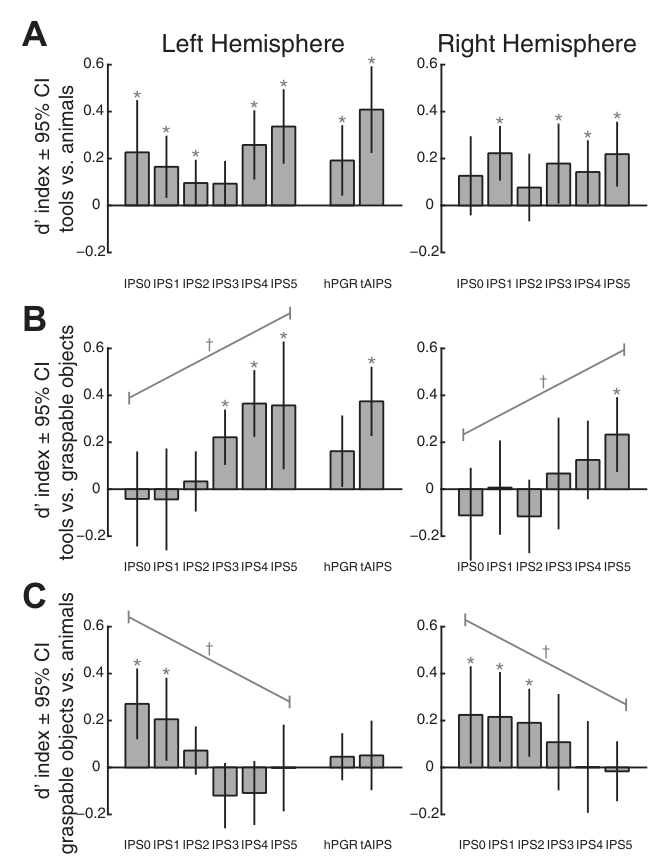
图 6 · V1 与腹侧—枕颞 ROI 的两两 d′ 对比
原文图注:Fig. 6. Pairwise comparisons of the differences between mean activation evoked by the 3 intact stimulus categories using a d′ index for early visual and occipital-temporal cortex ROIs. Conventions are the same as in Fig. 5. In occipital-temporal cortex, the comparison of tools and animals (A) confirmed the specificity of the functionally defined ROIs from the tool-animal localizer. LOC showed only slight differences across stimulus category in the left hemisphere and a bias for animals in the right hemisphere. Primary visual cortex displayed the weakest response to images of tools, consistent with its sensitivity to retinotopic image size. *P ≤ 0.05, significantly different from zero.
与图 5 同款排版,但对象是 V1、LOC、tPHC、aFF、tMT。A 中 tPHC、tMT 工具侧显著为正、aFF 显著为负,复现定位器定义的特异性;右半球 LOC 对动物有偏向(A 中工具一侧 d′ 为负,C 中可抓握一侧 d′ 为负)。或直接引用正文 P=0.03 / P=0.02 的结果。V1 在三张对比中都位于工具一侧(对工具反应最弱,d′ 为负),这个"负号"正是结果 2 结论的高阶性保障——差异方向与 IPS 相反,不可能由 V1 自下而上传播而来。
讨论
作者把数据组织成一个两级模型:后段 IPS(例如 IPS0–IPS2,可能分别对应猕猴 CIP 与 LIP)编码一切可抓握物体共有的基本视觉特征,工具只是其中一员;而到左前 IPS,这些信息与依赖经验的使用知识——动作关联、可供性、潜在目标——发生结合,所以只有工具(其动作关联是明确学得的)驱动 tAIPS。这一分工与失用症文献的双系统呼应:观念运动性失用患者保留了抓与握(感觉运动变换)而丧失了按功能使用工具,Goldenberg 与 Spatt(2009)的病灶分析也认为左后顶叶对"工具使用的一般机械原理"而非原型握法负责。作者据此提出"后 IPS 支持 generic grasping、前 IPS 支持 manipulation"的对应关系。至于 IPS5 中出现工具偏向,作者把它与人类 IPS5–猕猴 VIP 的功能对应(面周多模态空间表征、平滑追踪偏好、光流选择性)联系起来,推测猕猴 VIP 可能是人类工具特异回路的演化前体,与"工具使用动态扩张身体图式(body schema)"的证据(Iriki 等 1996;Maravita 和 Iriki 2004)相合;前 IPS 的表征则像猕猴 AIP 一样接受背、腹两侧的输入(AIP 与 LIP、CIP、TEO、TE 有解剖连接)。
作者承认的局限相当坦率:其一,主实验中被试不做任何动作、也未要求想象或准备动作,故前 IPS 的活动到底在多大程度上是视觉的、运动的还是两者兼有的,尚不能区分,需要未来研究厘清背侧流层级各阶段所表征的特征与视觉—运动变换的具体形式;其二,与 Valyear 等(2007)报告的"工具区在 hPGR 之后"相比,本研究发现该区在 hPGR 外侧偏下甚至更偏前,作者以任务与图像分析方法差异解释,但认为两研究并不完全矛盾(本研究也观察到 hPGR 后方、贯穿 IPS 的工具反应);其三,本研究虽然左右半球都出现梯度,但工具归类与操作网络总体是左偏侧的(Lewis 2006),两半球在任务中各起什么作用有待厘清;其四,猕猴 AIP 与人 hPGR 的同源性仅为功能定义上的推断,作者因此刻意采 hPGR 命名而不主张建立同源关系。
一句话总结
我读后的最大感受是:这篇文章把"工具区"从一团模糊的左前顶叶激活拆成了三块能在个体脑内分开的地块,而真正富信息量的是那条贯穿 IPS 的梯度——同一批可抓握物体,在 IPS 后端被当成"视觉上可抓握的东西"处理,到了前端只剩工具还说得上话。用"看照片、无动作要求"就拿到了这条梯度,尤其说明功能知识直接渗入了顶叶的物体表征;不过它仍是 fMRI 相关证据,视觉成分与经验成分在这条梯度上的配比,作者自己也还没能切开。
审校与证据追溯 (Verification & Evidence)
图表审计结果
- Fig1: 提取质量
good,对齐度full,识别面板[A, B] - Fig2: 提取质量
good,对齐度full,识别面板[] - Fig3: 提取质量
good,对齐度full,识别面板[A, B] - Fig4: 提取质量
good,对齐度full,识别面板[A, B] - Fig5: 提取质量
good,对齐度full,识别面板[A, B, C] - Fig6: 提取质量
good,对齐度full,识别面板[A]
关键事实与局限性声明
- 补充要点: 主实验仅分析三个完好类别,但作者明确说明纳入打乱物体后结果无质变(方法末段),MD 未提这一稳健性说明
- 补充要点: hPGR/tAIPS 的 ROI×类别交互不显著(F(1,2)=0.59, P=0.57)这一负结果被省略(它支持两区剖面相似的结论)
- 补充要点: 右侧 IPS 中工具 vs 动物仅边缘显著(P=0.066)且右半球类别主效应边缘(P=0.061)的较弱证据,MD 对右半球的描述(结果 3)基本到位但可更明确指出右半球效应整体偏弱