这篇文章问了适应(adaptation,即重复抑制,repetition suppression)对 IT 神经元编码物体的"准确性"本身是利是弊——而在此之前,多数工作只盯着反应量的下降。作者基于两组既有实验数据做判别力分析:重复刺激的判别力 d′(d-prime)下降,而"与刚看过的刺激不同"的交叉适应条件下判别力反而可以增强,从而把短期适应解释为一种偏向新异信息的自适应编码策略。
研究背景
猕猴 IT 皮层大量神经元对重复出现的刺激反应下降——"重复抑制"或"适应"效应——这一现象因 fMRI 适应范式的广泛应用而备受关注;已有工作把短时程(短 adapter 与短 ISI)的适应归因于输入抑制或突触抑制。但适应的功能后果始终不明。早期视觉区的研究报告过相反方向的现象:在 V1、V4,适应能提升刺激判别力(如 Müller 等 1999、Dragoi 等 2002、Wang 等 2011),这与 Barlow(1961)的高效编码假说一致。
问题就在这里:重复抑制在 IT 中比更早的视觉区更强(Orban 和 Vogels 1998),那么按高效编码假说,IT 中被适应的刺激是否也应该被编码得更好?这一问题没有被直接检验过。同时 fMRI 适应范式的解释学之争(重复抑制到底反映调谐锐化、平均化还是响应减小)也急需一个单细胞层面的判别力答案。本文的缺口就是把"反应量变化"翻译成"表征准确性变化"。
研究思路
作者的策略是重分析两组为其他问题设计的实验数据,用信号检测论的 d′ 指标和群体解码直接量化判别力,并让 adapter 与 test 之间的形状差异参数化地变化,从而把"重复同一刺激"与"交叉适应"分开比较。这个设计的关键逻辑是:如果适应是刺激特异的(对重复刺激的抑制大于对交叉刺激的抑制),那么适应到弱刺激时,后续强刺激与弱刺激的反应差反而被拉开,d′ 应当上升;适应到强刺激时反应差被压缩,d′ 应当下降——两个方向都测,才能看出适应在何时帮何时损。
实验一用单细胞测量参数化形状(形态渐变形),回答"单个神经元的判别力"问题;实验二用层状探针同步多通道 MUA(multiunit activity,多单元活动)加线性解码器,回答"群体是否也如此"的问题,因为单个神经元对 A/B 的 P/L 属性可以互换,个体效应在群体里可能互相抵消。时间窗分析还被用来检验适应的"易化模型"(faster processing of repeated stimuli)。
方法
两个实验各用两只恒河猴(其中一只两实验都参加)。实验一(单细胞,n=80 个有反应神经元,每只猴 40 个):刺激为 4 组各 6 个经 morph 渐变生成的有阴影三维形状(高度 5.4°–7.2°,面积与平均亮度配平),中央凹呈现;先测形状选择性,再跑适应测试——6 个 adapter 各接 6 个 test,共 36 种序列,每个 300 ms、ISI 也是 300 ms,期间猴子保持注视(注视窗 ≤2°),成功注视给苹果汁奖励;每个适应 trial 之后插入两个打乱图像 trial 以解除适应,每条件平均 8.11 个有效 trial。
实验二(MUA,16 通道层状探针,通道间距 100 μm,记录于 STS 下岸):32 次穿次、468 个有反应位点,每穿次从 52 张彩色物体图像中选两张;每张呈现 500 ms、ISI 500 ms,trial 为重复(AA/BB)或交替(AB/BA);分析多用刺激后 60–310 ms 窗(早期适应更强)。分析上,d′ = |M(P)−M(L)|/√((σ²(P)+σ²(L))/2),P 为该神经元偏好形状、L 为沿 morph 维距离 1–3 个值级的形状;P/L 定义为该位点对两刺激作为 adapter 呈现时反应最大/最小者。群体解码用基于相关系数的分类器(最多 16 个位点,每条件 1000 次交叉验证打乱标签对照,机会水平 50%),并分别做了"各条件分别训练"与"只用 adapter 训练"两种读出。
主要结果
- 重复降低单神经元判别力:以 d′ 衡量,test 在重复 trial 中(Test(PP, LL))显著低于作为 adapter 时与交替 trial 中(Test(PL, LP));适应到偏好形状(Test(PP, PL))同样显著降低 d′;适应到非偏好形状(Test(LL, LP))有增强趋势但不显著(post hoc p=.22)。所有单细胞 test 相对 adapter 反应中位数下降 22%。距离效应显著(F(2,158)=39.746)且条件效应显著(F(4,316)=17.061)(图 2A)。
- d′ 变化主要由平均反应差驱动、而非方差:重复 trial 中重复刺激被抑制得更多(SUA:Test(PP) 34.72 spikes/s vs Test(LP) 39.87),Fano factor(Fano 因子)只轻微变化(adapter 0.90 → test 1.2–1.3),效应可完全由均值压缩解释(表 1、表 2)。
- 交叉适应可反向增强判别力:对偏好形状在形状维两端(n=26)的神经元,adapter 为最不偏好形状(值 5)时偏好形状对的 d′ 显著高于 adapter 基线(p=.0201),与 V1 的 Dragoi 等(2002)一致;而 adapter 为偏好形状时显著降低(p=.0014)。但换成非偏好形状对做检验时,没有出现这种增强(p=.8093)——增强同时依赖 adapter 与 test 两侧的有效性(图 3、表 3)。
- MUA 群体复现且更清晰:条件效应显著(F(4,1868)=209.56);Test(PP, LL) 的 d′ 低于 adapter 与交替条件,而 Test(LL, LP) 的 d′ 显著高于 adapter 与交替 test(均 p<10⁻⁶)。重复抑制极其普遍(90% 的"刺激×位点"组合出现),且集中于反应的前半段(图 2B、图 4A)。
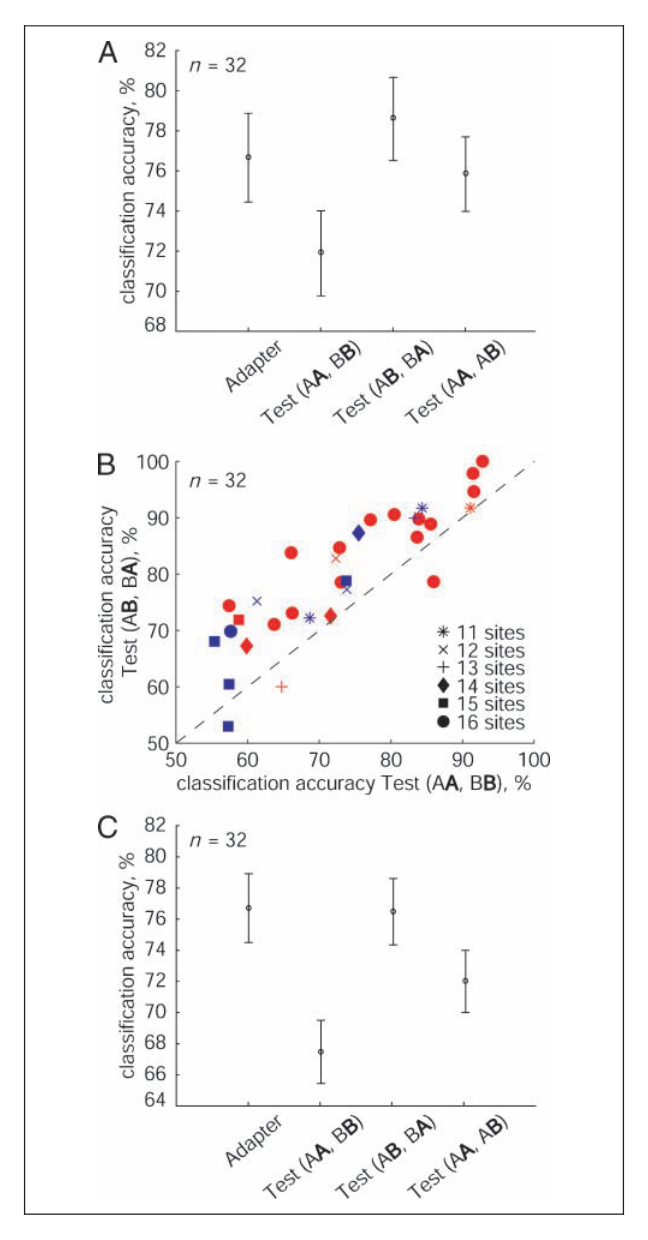
- 群体解码:小群体(每穿次中位 15.5 个位点)分类 accuracy 中,重复 test 最低(72%),交替 test 最高(79%),Test(AA, AB) 76%,adapter 介于其间;32 次穿次中仅 3 次不出现重复降低。用固定读出(只用 adapter 训练的分类器)时重复 test 67% vs adapter 77%(p<10⁻⁶)。短至 12.5 ms 的窗口已能可靠解码,峰值 accuracy 随窗长增至 50 ms 接近最大;重复影响的是信息量峰值而非其出现时间——与适应"易化模型"(重复刺激加工更快)矛盾(图 4、图 6)。
图注解读
图 1 · 刺激与适应范式
原文图注:Figure 1. Stimuli and adaptation paradigm. (A) Illustration of one set of shapes employed in the single cell study (Experiment 1). The letters serve to identify each of the shapes. (B) Schematic of adaptation test with two of the images employed in the simultaneous MUA recordings study (Experiment 2). Top and bottom illustrate a repetition and alternation trial, respectively. In both experiments, the animals were required to fixate a small fixation target (shown here not to scale) presented at the center of a monitor for 500 msec before stimulus onset (FIX). The adapter (S1) and test (S2) stimuli were shown for 300 and 500 msec in Experiments 1 and 2, respectively, and separated by an ISI of the same duration as the stimulus. Monkeys were required to fixate during the entire trial, including the poststimuli (POST) interval, lasting 300 and 475 msec in Experiments 1 and 2, respectively. Successful fixation throughout a trial was rewarded by a drop of apple juice.
A 是实验一的一组 morph 形状(字母只是给形状命名),B 是实验二的 trial 结构示意:上为重复 trial(同一图连续出现),下为交替 trial。注意 S1(adapter)与 S2(test)时长两实验不同(300 vs 500 ms),ISI 与刺激等长,全程需注视并在 POST 段保持。这张图是理解后面所有条件记号(PP、PL、AA、AB 等)的钥匙。
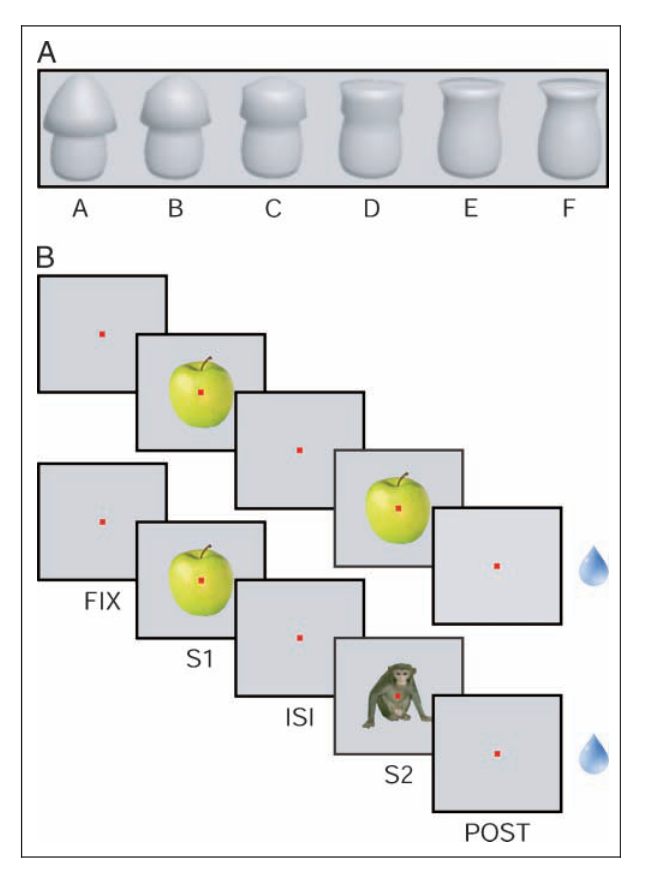
图 2 · 五种适应条件下的 d′
原文图注:Figure 2. Mean discriminability index d0 for adapter and test stimuli across different adaptation conditions. (A) Mean d0 of single neurons (n = 80) measured at three different distances (D) between the preferred (P) and less preferred (L) shapes for five different conditions: shapes presented as adapter, shapes presented as test in repetition trials (Test(PP, LL)), shapes presented as test in alternation trials (Test(PL, LP)), and shapes presented as test of which one was following an identical adapter and the other shape was following the different adapter (Test(PP, PL) and Test(LL, LP)). (B) Mean d0 of MUA activity (n = 468 responsive sites) for the same five conditions as in A. Each MUA site was stimulated by two stimuli P and L that were defined as the stimuli eliciting the largest and smallest response, respectively, when presented as adapter. In both A and B, bars indicate standard errors of the mean and bold letters correspond to the stimulus pairs for which d0 was computed.
横轴为五种条件(adapter、Test(PP, LL)、Test(PL, LP)、Test(PP, PL)、Test(LL, LP)),每个距离一组柱,纵轴为平均 d′。读法:先看 Test(PP, LL) 柱低于 adapter 与交替柱(重复抑制损编码),再看 Test(LL, LP)——MUA 中它明显高于 adapter 与交替柱(交叉适应可增强),而单细胞中只是趋势。A 与 B 方向一致,是"单细胞结论可推广到群体反应"的直观证据。
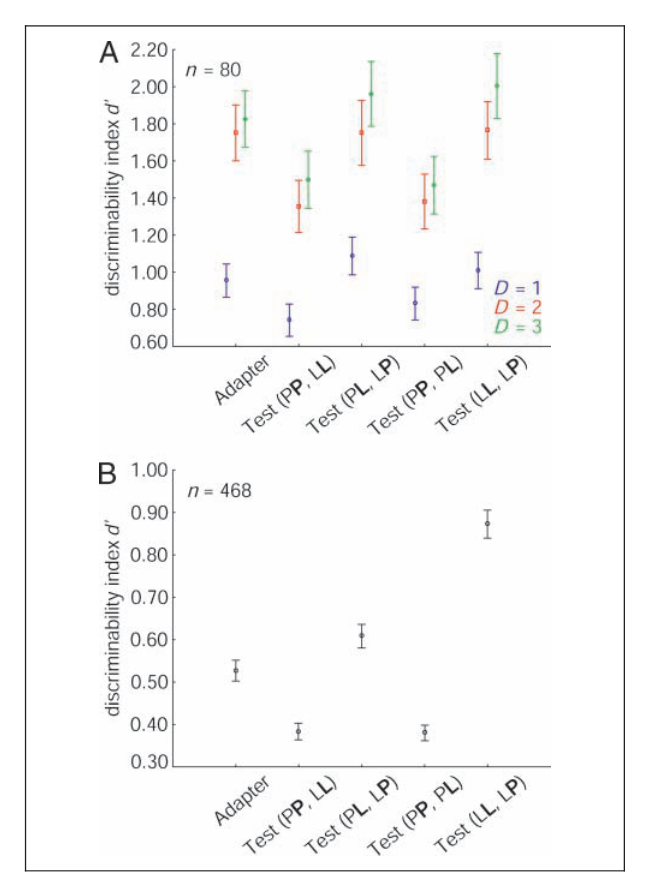
图 3 · 适配器沿形状维取值对 d′ 的调制
原文图注:Figure 3. Mean discriminability index d0 of single IT neurons plotted as a function of the adapter value of the parameterized shape. Adapter value: 1 = preferred shape; 5 = less preferred shape differing by 4 values from the adapter. (A) d0 computed for the preferred shape (value = 1) and the shape with value 3 (i.e., distance = 2) presented as tests. (B) d0 computed for the less preferred shape with value 5 and the shape with value 3 (i.e., distance = 2) presented as tests. The d0 value for the same shapes presented as adapters is indicated by the stippled horizontal line. Only the neurons (n = 26) for which the preferred shape was either an extreme (A and F in Figure 1A) or differed by one value from the extreme (B and E in Figure 1A) were considered for this analysis. Bars indicate standard errors of the mean. Insets: schematic monotonic tuning curves with stimuli used to compute d0 indicated by filled, gray circles and connected by a thick black line.
横轴是 adapter 在 morph 维上的取值(1 = 该神经元的偏好形状,5 = 最不偏好),点划横线是同一形状对作为 adapter 时的 d′ 基线,纵轴是 test 的 d′。A(偏好形状对):曲线左端显著低于基线、右端显著高于基线——"适应到什么"决定了方向;B(非偏好形状对):有 adapter 取值效应但两端都不显著偏离基线。在结果 3 或图 3 解读中补充:原文指出图 3A 的 d′ 增强主要源于交叉适应条件下反应变异(SD)的降低,而非平均反应差的增大;主条件(图 2)的 d′ 变化才主要由均值驱动。此图支撑结果 3"增强依赖两侧有效性"的论断。
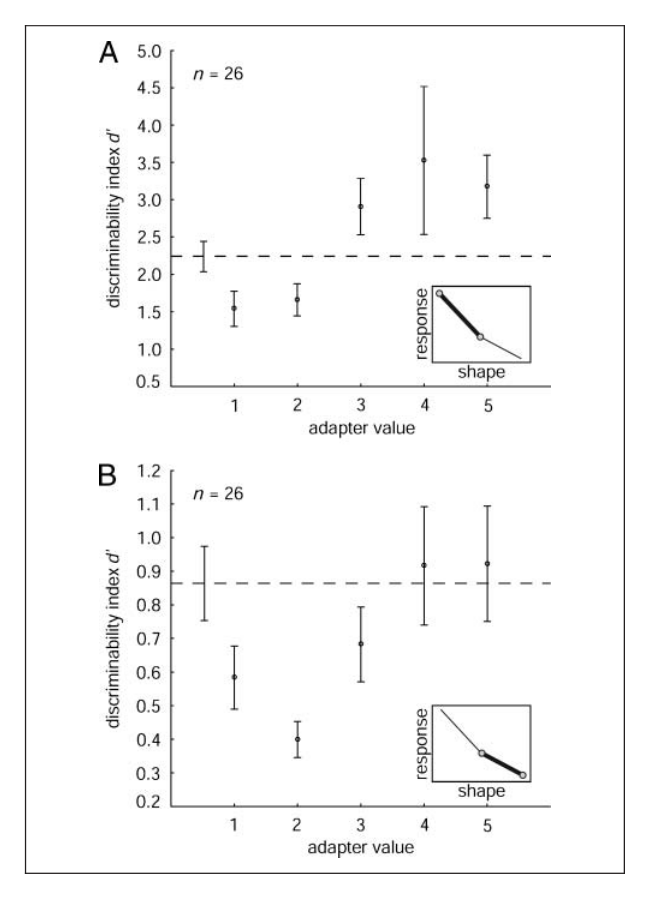
图 4 · MUA 与解码精度的时间进程
原文图注:Figure 4. Time course of MUA and classification accuracy. (A) Population PSTH of the mean spiking activity, averaged across all responsive recording sites of both animals, in repetition (Rep trials) and alternation (Alt trials) trials. Responses are aligned on the onset of the adapter stimulus. Stippled vertical lines indicate stimulus on- and offsets. Firing rates were computed with a sliding window of 50 msec with a step of 10 msec. (B) Mean classification accuracy computed with different sliding window durations (see legend) for repetition trials (AA and BB trials). Mean accuracies are plotted at the center of the corresponding window (e.g., accuracy for the 0–50 msec window plotted at 25 msec); 0 msec corresponds to the onset of the adapter stimulus. Chance level is 50%. (C) Mean classification accuracy for four adaptation conditions (see legend), obtained with a sliding window of 50 msec and aligned on stimulus onset. Mean classification accuracy obtained when shuffling the stimulus labels across trials of a condition (Shuffled) were computed using the same sliding windows and did not differ from the chance level (50%). Training and testing was done for each condition and window separately using the correlation-based classifier. Vertical stippled lines indicate stimulus on- and offset. Bands indicate standard errors of the mean.
A:重复与交替 trial 的群体 PSTH,重复抑制集中在反应前段。B:不同窗长(12.5–100 ms)下重复 trial 内 adapter 与 test 的解码精度时间曲线,峰值精度随窗长增大至 50 ms 接近饱和,且 test 峰值始终低于 adapter——但峰值出现的时间不变。C:50 ms 窗下四种条件的精度曲线,重复 test 全程最低,ISI 尾部有略高于机会水平的延迟活动。此图支撑结果 5 中"影响信息量而非时间"与"12.5 ms 即可解码"两点,也是反驳易化模型的直接证据。
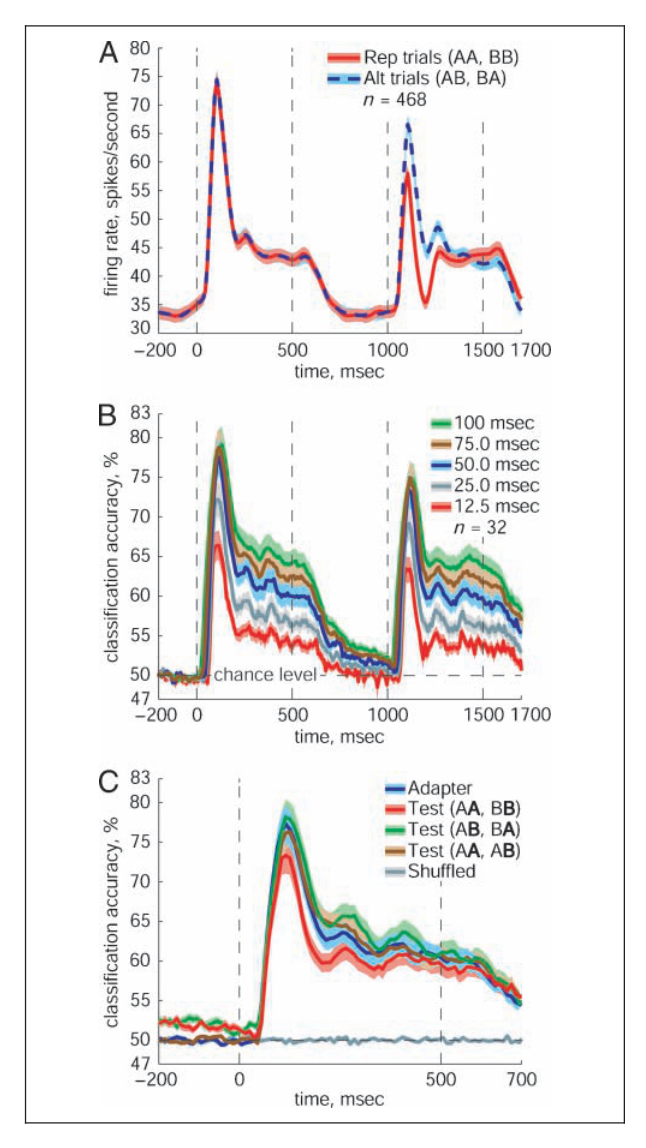
图 5 · d′ 变化的机制示意
原文图注:Figure 5. Illustration of effects of adaptation on neuronal discriminability. The two distributions in each row represent the responses to the P (solid line) and L (stippled line) stimuli. Top row: response distributions for stimuli presented as adapter; middle row: response distributions for stimuli when adapting to P; bottom row: response distributions for stimuli when adapting to L. Adaptation to P produces a larger reduction of the response to the repeated stimulus P than to L, resulting in a decreased discriminability. When adapting to L, the response to the repeated stimulus L is more suppressed compared with the response to P, which enhances discriminability between them. The Fano factor was equated for all response distributions. Note that the distributions do not represent real, recorded data but serve to explain graphically the differential effects of adaptation to P and L stimuli.
这是作者自制的概念图,不是数据。每行画 P(实线)与 L(虚线)两个反应分布:上行是 adapter 基线,中行是适应到 P 之后(P 分布被压得更狠,两分布靠拢 → d′ 下降),下行是适应到 L 之后(L 分布被压得更狠,两分布拉开 → d′ 上升)。所有分布的 Fano factor 被设为相同以突出均值效应。它把表 1 的数字机制一图讲清,是全文解释框架的浓缩。
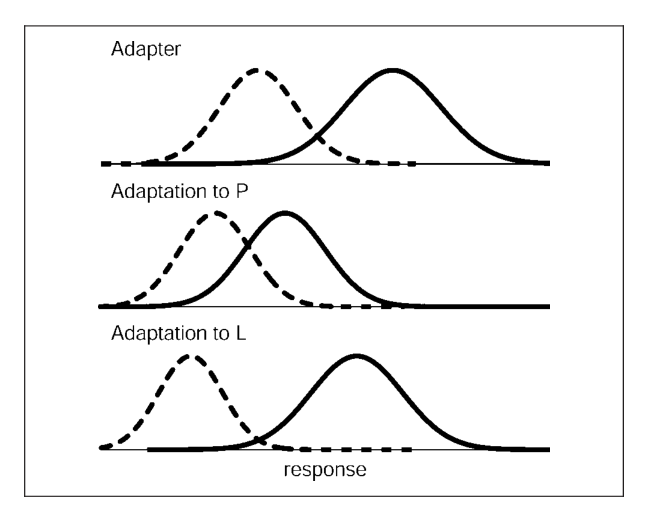
图 6 · 群体分类精度与读出方式
原文图注:Figure 6. Classification accuracy (n = 32 penetrations) of MUA. (A) Mean classification plotted for four adaptation conditions: adapter stimulus, test stimulus in repetition trials (Test(AA, BB)), test stimulus in alternation trials (Test(AB, BA)), and the average of two conditions Test(AA, AB) and Test(BB, BA) (here indicated by Test(AA, AB)). Classification accuracies were obtained when training and testing classifiers on the data of each condition separately. Bars indicate standard errors of the mean, and bold letters correspond to the stimuli for which classification was performed. (B) Classification accuracy for the test stimuli in alternation trials plotted against the classification accuracy for the same stimuli in repetition trials. Each point corresponds to a single penetration. Different symbols and colors label penetrations according to the number of responsive sites of a penetration and animal, respectively. The diagonal is indicated by a stippled line. (C) Mean classification plotted for four adaptation conditions when the classifiers were trained only with response vectors for the adapter stimuli and then tested for each condition. Abbreviations are the same as in A.
A:四条件下各条件分别训练的解码精度,重复 test(Test(AA, BB),72%)显著低于其余三者(>76%)。B:散点图,每点一次穿次,横轴重复 test、纵轴交替 test 的精度——绝大多数点位于对角线上方(交替更高),且这一模式跨动物与位点数都稳定。C:改用"只用 adapter 训练"的固定读出分类器,重复 test 与 adapter 的差距仍然存在(67% vs 77%),说明结论不依赖读出端在学习上的调整。此图是群体解码结论(结果 5)的主证据。
讨论
作者的总结是:在不夹其他刺激的短期重复下,IT 神经元对重复刺激的判别力一致变差,这出现在单细胞与 MUA 两个独立数据集里,且在极短的解码窗下也成立——"IT 中物体的表征准确性不但没有被重复增强,反而被损伤";但交替序列中,若 test 与刚看过的刺激不同,判别力可以增强。d′ 的变化基本由各条件下反应被抑制的幅度差异解释(重复抑制对重复刺激更强),方差几乎不动。功能含义被作者概括为:在自由注视中同一物体或不同物体被依次注视,这种刺激特异的适应会削弱对"刚看过的"的编码、增强对"新看到的"的编码——对一个识别/分类系统来说这是合理策略(刚看过的物体不必重新识别),还可能节省代谢,并可能与自然动作序列中的预期性反应及短时识别记忆有关。
作者明确划定了结论边界:这些结论只适用于短期适应(短 ISI、无插入刺激);Weiner 等(2010)的 fMRI 多体素解码显示长延迟(约 20 s)加插入刺激时重复反而提高分类精度,故 ISI 与插入刺激的作用留待未来检验。与其他区域对话方面:本文不支持 Gotts 等提出的"重复增强低频同步"计算方案——25 Hz LFP 功率增加只在两只猴中的一只出现,且 12.5 ms 窗下的解码降低说明同步增加补偿不了反应下降;同时 Kaliukhovich 和 Vogels(2012)还发现重复降低 50 Hz 以上的 MUA–LFP 同步,按 Fries(2009)的巧合检测假说这是雪上加霜。与 V4(Wang 等 2011:d′ 增加且伴随伽马增强)和 MT(Krekelberg 等 2006:约 2% 的速度判别改善)的分歧,作者谨慎地归因于适应范式(ISI 时长、adapter–test 关系)的差异而非区域差异。最后作者区分了适应与重复启动(repetition priming):启动研究用新异刺激,而熟悉化带来的调谐锐化是另一回事。
一句话总结
在我读来,这篇文章用一个很干净的逻辑闭合了"适应是否有功能收益"的争论:收益不是给"重复的东西"准备的,而是给"变化的东西"准备的——d′ 随 adapter–test 关系而方向翻转,正是刺激特异抑制的直接后果。方法上值得学的是把"反应量"翻译成"判别力"的那一步以及双实验(单细胞+群体解码)的互相支撑;局限也很清楚——被动注视、短 ISI、熟悉刺激,作者自己都提醒长时程与启动情形可能是另一番图景。
审校与证据追溯 (Verification & Evidence)
图表审计结果
- Fig1: 提取质量
good,对齐度full,识别面板[A, B] - Fig2: 提取质量
good,对齐度full,识别面板[A, B, D] - Fig3: 提取质量
good,对齐度full,识别面板[A, B, E, F] - Fig4: 提取质量
good,对齐度full,识别面板[A, B, C] - Fig5: 提取质量
good,对齐度full,识别面板[] - Fig6: 提取质量
good,对齐度full,识别面板[A, B]
关键事实与局限性声明
- 审校纠偏: 无显著过度推论。讨论部分的功能性推测('合理策略'、'节省代谢'、'与自然动作序列中的预期性反应及短时识别记忆有关')均能在原文 Discussion 中找到对应且作者本身即用推测语气(might/may),MD 正确归属为作者观点;结论边界(仅短期适应、短 ISI、无插入刺激,Weiner et al. 2010 长延迟结果相反)也被 MD 完整保留。一句话总结中的评论已以'在我读来'标明为评述者观点。
- 补充要点: 眼动对照:原文 Methods 明确引用 De Baene & Vogels (2010) 与 Kaliukhovich & Vogels (2012) 的眼动分析,证明刺激特异的重复抑制不能由 adapter/test 间眼动差异解释;MD 全文未提及此对照。
- 补充要点: 实验二每猴位点数拆分(319 vs 149)及刺激构成(63% 无生命物体、分形仅 2 次)未提及,属次要方法细节。
- 补充要点: MUA 数据中 Test(PP, LL) 与 Test(PP, PL) 的 d′ 无显著差异(原文明确报告),MD 未提;这对理解'适应到 P'与'两者都重复'的等价性有一定信息量。
- 补充要点: 图 4C 的 ISI 尾部延迟活动(高于机会水平的解码)原文自评为 peripheral finding,MD 已在图注解读中覆盖,不算遗漏。