这项研究系统比对了 37 种计算视觉模型(涵盖生物神经启发模型、传统计算机视觉工程特征,以及大规模有监督训练的深度卷积神经网络)与人类 fMRI 及猕猴单单元电生理记录的下颞叶(inferior temporal cortex, IT)表征几何。研究发现,未经监督或仅经弱监督训练的模型仅能解释 IT 表征几何的一小部分;而经过大规模目标分类监督训练的深度网络在经过线性重混合后,能够充分解释生物 IT 的表征相异度结构。该工作从计算表征匹配角度,量化分析了工程模型与灵长类高级视皮层之间的表征关系。
研究背景
下颞叶皮层(IT)对视觉物体的神经响应不仅包含具体图像的低级特征,还呈现出高度结构化的表征几何(representational geometry):在表征空间中距离较近的刺激样本,往往对应人类与动物在感知上具有相似语义或易于混淆的物体类别。既往研究在人类与猕猴 IT 中均观察到稳定的生命体/非生命体以及面孔/躯干等类别聚类结构。然而,早期计算视觉模型(如 HMAX、标准小波模型或浅层自编码器)能否产生类似的表征拓扑,此前缺乏大规模系统的定量检验。
与此同时,计算神经科学领域对于高级视觉表征的形成机制存在分歧:一类观点认为自下而上的无监督统计学习(如稀疏编码、慢特征分析)足以支撑视知觉表征的建立;另一类观点则强调目标分类任务驱动的有监督优化在塑造类别分离表征中的核心作用。为厘清这一问题,需要利用同一组标准化物体刺激,将广泛的计算模型与多模态生物电生理/功能成像数据置于统一的表征相似性分析(RSA)框架下进行系统比对。
研究思路
研究采用递进对比分析策略:首先评估 27 种“非强监督”(not-strongly-supervised)模型表征,包括未受训练的随机模型、无监督特征提取模型,以及仅在小规模数据集上进行浅层弱监督训练的模型,检验其表征相异度矩阵(RDM)与生物 IT 表征几何的吻合程度。
在发现非强监督模型普遍无法充分解释生物 IT 数据后,研究进一步测试了特征重组与优化假说:通过线性支持向量机(SVM)对各模型特征进行重新加权与混合,观察监督读出操作能否弥补底层特征的不足。最后,研究引入基于 ImageNet(120 万张图像、1000 类目标)强监督训练的八层深度卷积神经网络(AlexNet 架构),逐层提取神经元激活响应并构建 RDM,同时利用跨验证线性优化拟合生物 IT 的相异度结构,直接评估深层网络层级表征与人类及猕猴高级视皮层的匹配度。
方法
神经数据源自既往发表的标准化测试集,包含 96 幅呈现在白色背景下的孤立彩色物体图像,在语义层级上平衡涵盖生命体(人类面孔/躯干、动物面孔/躯干)与非生命体(自然物、人造物)。人类 IT 数据来自 15 名受试者的 fMRI 测量(Kriegeskorte 等,2008),猕猴 IT 数据来自两只猕猴共 107 个多单元记录位点(Kiani 等,2007)。
模型评测涵盖 37 种视觉表征:包含 27 种非强监督模型(如 GIST、SIFT、HMAX、VisNet、稀疏编码、自编码器等)以及深度监督卷积网络(8 层结构,前 5 层为卷积,后 3 层为全连接)。利用表征相似性分析(RSA)计算每种表征下 96 幅图像两两之间的相异度(1 减去相关系数),构建 96×96 的 RDM。模型与神经表征的相似度采用 Kendall 等级相关系数(τA)进行衡量,并计算基于受试者间变异度的噪声天花板(noise ceiling)。此外,通过类别性指数定量测度矩阵的聚类显著性,并利用线性支持向量机评估表征空间对目标类别(如生命体 vs 非生命体)的分类解码能力。
主要结果
- 非强监督模型无法充分解释 IT 表征几何:27 种非强监督模型的 RDM 与人类 IT 的等级相关系数 τA 均不高于 0.17,与猕猴 IT 不高于 0.26(图 1、图 2)。即使将全部 27 种模型的特征串联构成组合模型,其解释度依然显著低于噪声天花板下限。
- 非强监督模型缺乏生物 IT 的类别聚类结构:聚类分析显示,非强监督模型中的类别聚类成分解释方差极低(图 3),其类别性指数显著落后于人类与猕猴 IT(图 4),表明其表征空间主要受底层像素级与纹理级相异性驱动。
- 特征重组无法弥补非强监督模型的表征缺陷:即使利用基于类别标签训练的支持向量机决策值对非强监督特征进行重新加权和混合,重构后的 RDM 与生物 IT 的相关性仍未见实质提升(图 5)。
- 深度监督网络的层级表征随深度递增匹配 IT:在 ImageNet 上强监督训练的深度卷积网络中,各层与 IT 的相关度呈现自浅至深的阶梯式上升(图 6、图 7)。到第 7 层全连接层,模型表征已高度展现出生命体/非生命体的分离拓扑(图 8、图 9)。
- 重加权后的深层表征达到生物数据噪声天花板:通过对深度网络第 7 层特征实施针对 IT 表征几何的交叉验证线性重加权,模型在独立测试图像上的 RDM 与人类及猕猴 IT 的相关性达到了数据内部一致性所设定的噪声天花板区间(图 7、图 10)。
- 表征对生物 IT 的解释度与类别分类性能显著正相关:在全部 37 种模型中,表征几何越接近人类与猕猴 IT 的模型,其基于线性分类器的生命体二分类准确率越高(图 11、图 12)。
图注解读
图 1 · 与 IT 最相似的七个非强监督模型 RDM
原文图注:Figure 1. Representational dissimilarity matrices for IT and for the seven best-fitting not-strongly-supervised models. The IT RDMs (black frames) for human (A) and monkey (B) and the seven most highly correlated model RDMs (excluding the representations in the strongly supervised deep convolutional network). The model RDMs are ordered from left to right and top to bottom by their correlation with the respective IT RDM. These are the seven most higly correlated RDMs among the 27 models that were not strongly supervised and their combination model (combi27). The number below each RDM is the Kendall tA correlation coefficient between the model RDM and the respective IT RDM. All correlations are statistically significant.
该图对比人与猕猴 IT 皮层(黑框)以及 7 个拟合最佳的非强监督模型的表征相异度矩阵(RDM)。模型矩阵按与 IT 矩阵的相关度由高到低排列。结果显示,虽然模型能够部分反映低级视觉特征的相异性,但均未能重现生物 IT 中清晰可见的生命体与非生命体二元分类大聚类结构。
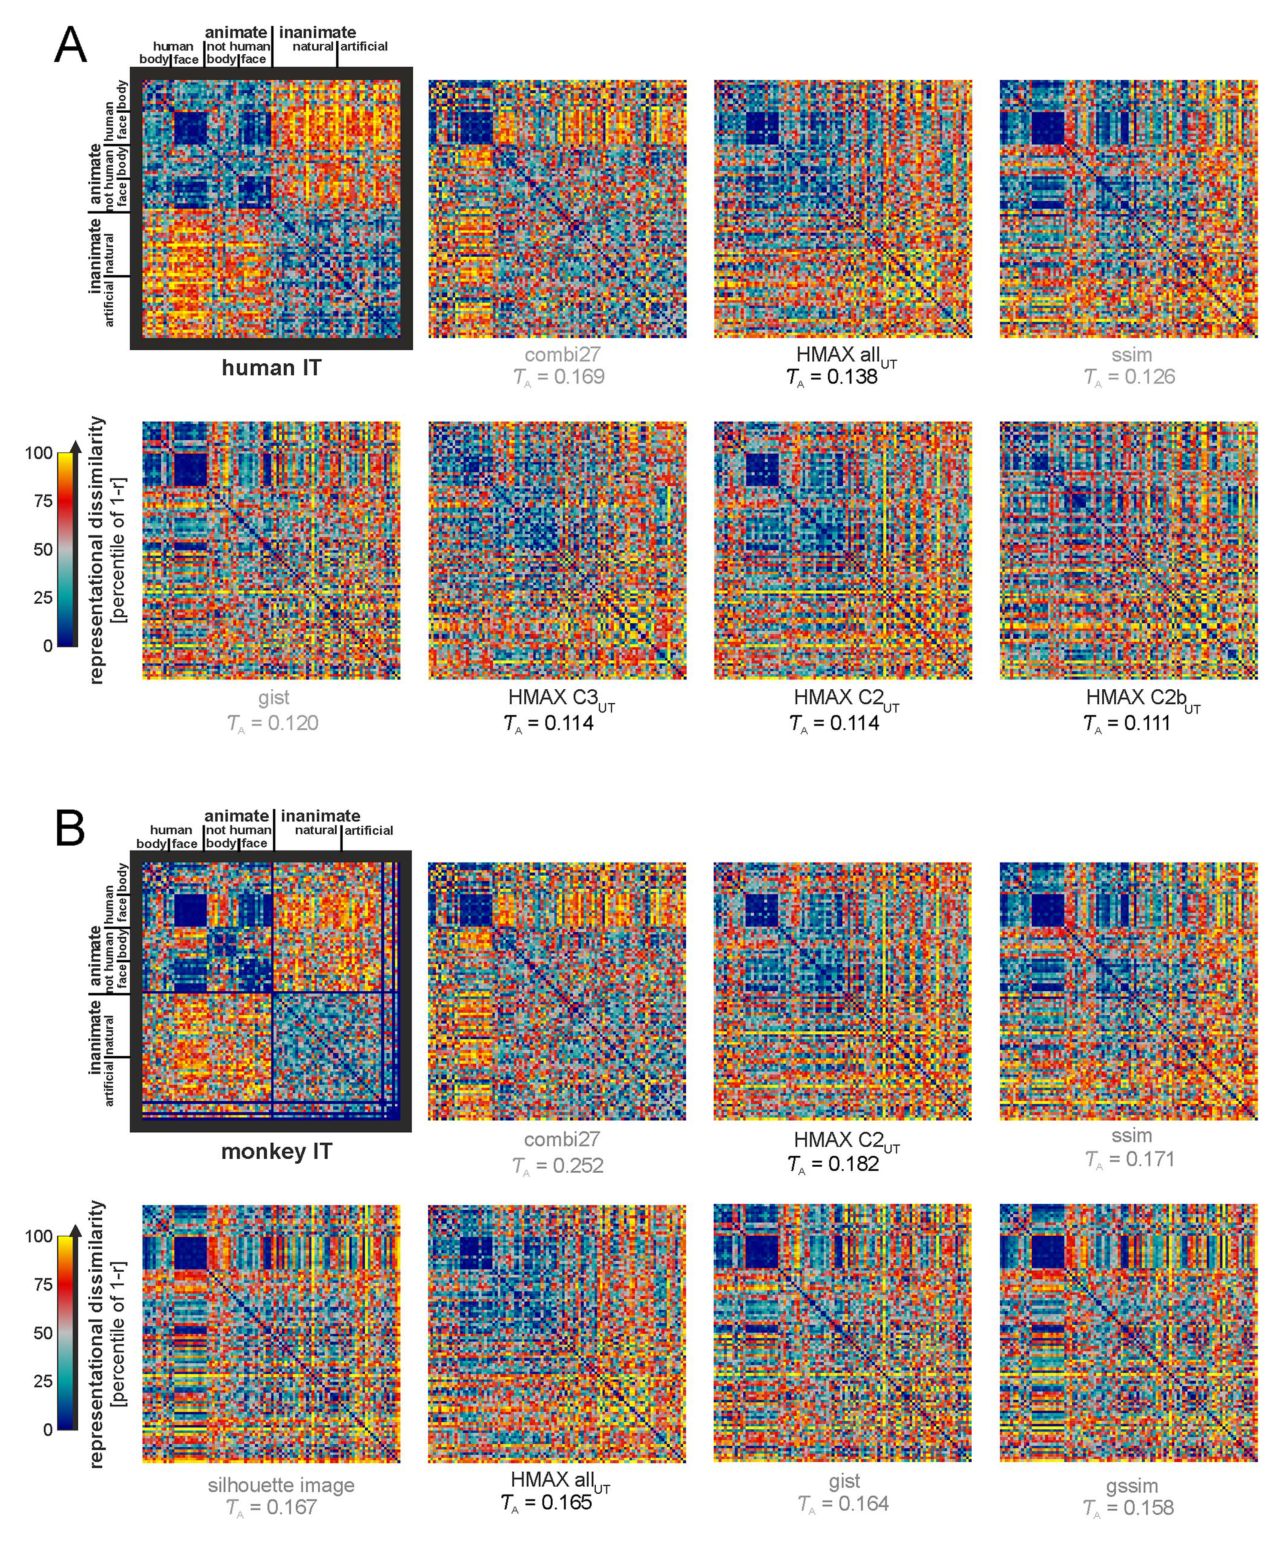
图 2 · 非强监督模型与 IT 的相关均低于噪声天花板
原文图注:Figure 2. The not-strongly-supervised models fail to fully explain the IT data. The bars show the Kendall-tA RDM correlations between the not-strongly-supervised models and IT for human (A) and monkey (B). The error bars are standard errors of the mean estimated by bootstrap resampling of the stimuli. Asterisks indicate significant RDM correlations (random permutation test based on 10,000 randomizations of the stimulus labels; ns: not significant, p,0.05: , p,0.01: , p,0.001: , p,0.0001: **). The noise ceiling (gray bar) indicates the expected correlation of the true model (given the noise in the data). None of the not-strongly-supervised models reaches the noise ceiling.
该图展示各非强监督模型表征与人类 IT(左)及猕猴 IT(右)RDM 的 Kendall τA 等级相关。条形图依据无监督训练(UT)、弱监督训练(ST)或未经训练(无标注)进行分组标识。所有非强监督模型的解释度均显著低于数据噪声天花板(灰色阴影区),最高相关系数未超过 0.26。
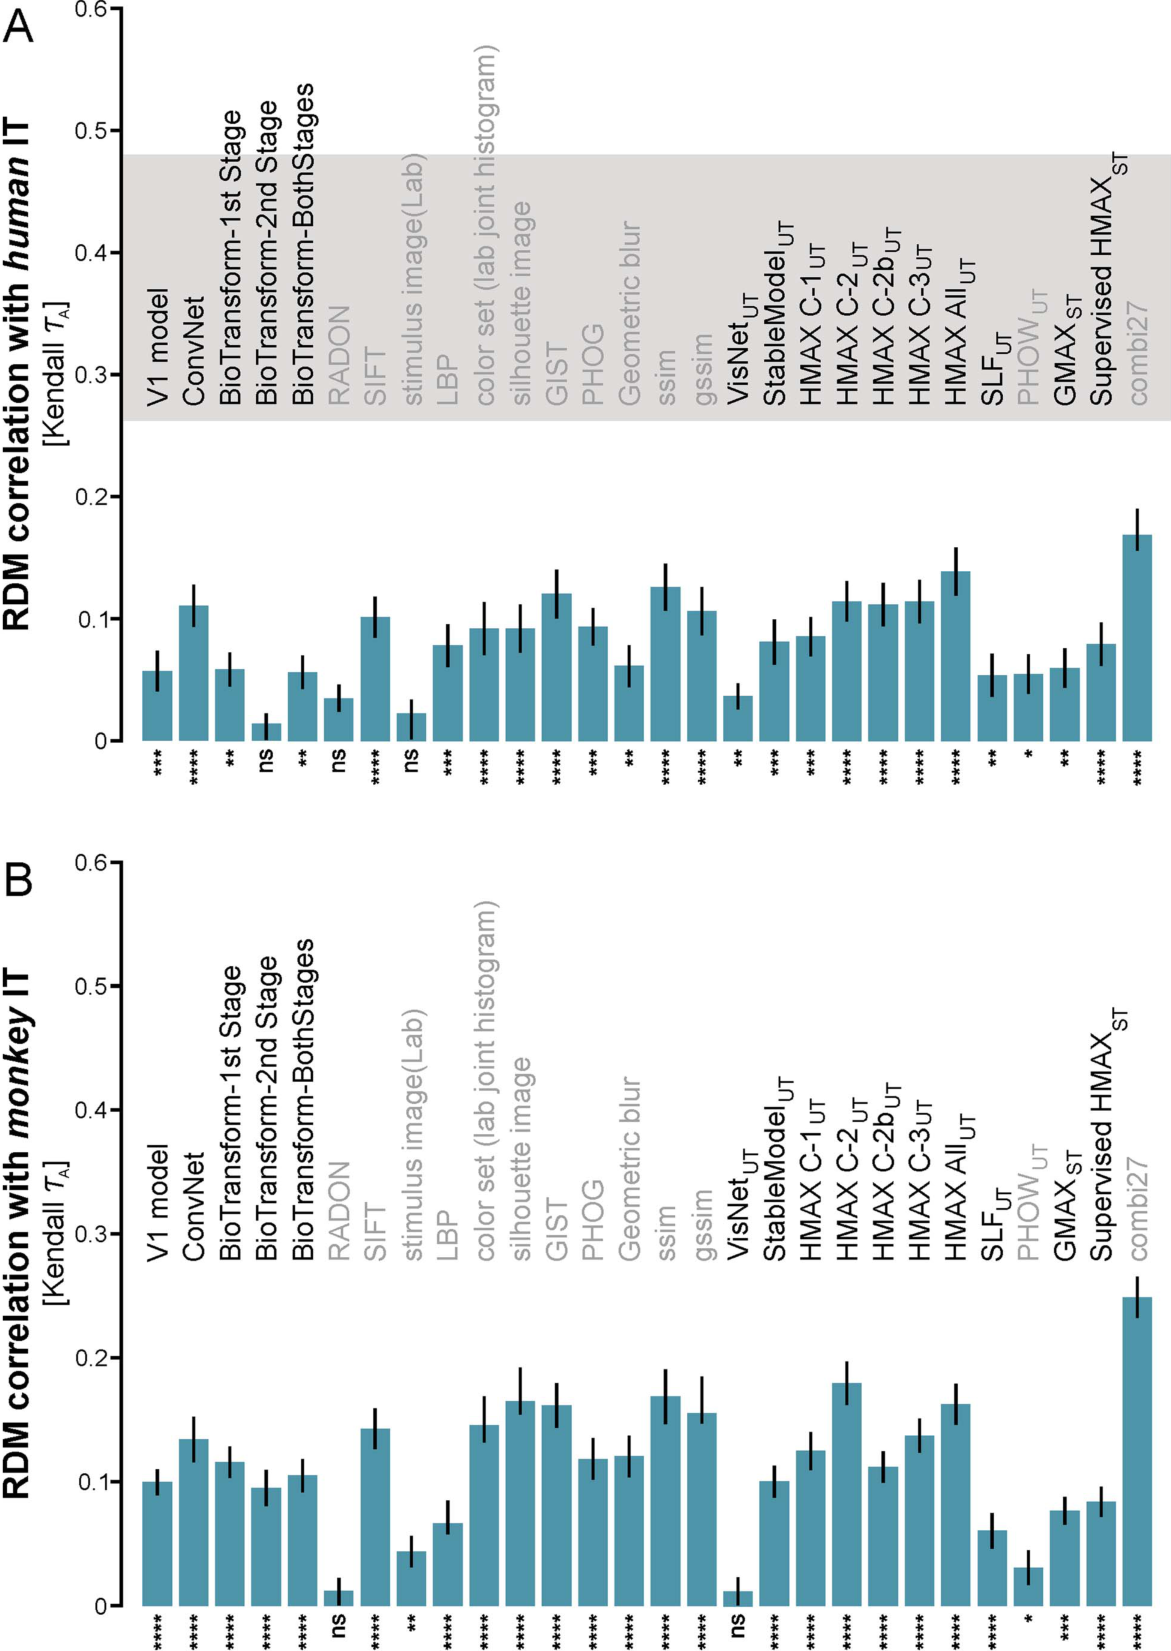
图 3 · 非强监督模型中看不见 IT 式的类别结构
原文图注:Figure 3. IT-like categorical structure is not apparent in any of the not-strongly-supervised models. Brain and model RDMs are shown in the left columns of each panel. We used a linear combination of category-cluster RDMs (Figure S5) to model the categorical structure (least-squares fit). The categories modeled were animate, inanimate, face, human face, non-human face, body, human body, non-human body, natural inanimates, and artificial inanimates. The fitted linear-combination of category-cluster RDMs is shown in the middle columns. This descriptive visualization shows to what extent different categorical divisions are prominent in each RDM. The residual RDMs of the fits are shown in the right column.
该图分析模型中类别聚类结构的显著性:左侧为原始模型 RDM,中间为经过十折交叉验证提取的类别聚类成分,右侧为聚类拟合后的残差结构。在所有非强监督模型中,类别聚类成分解释的方差均极小,残差仍占据主体,表明其特征空间未自发形成类似 IT 的类别边界。
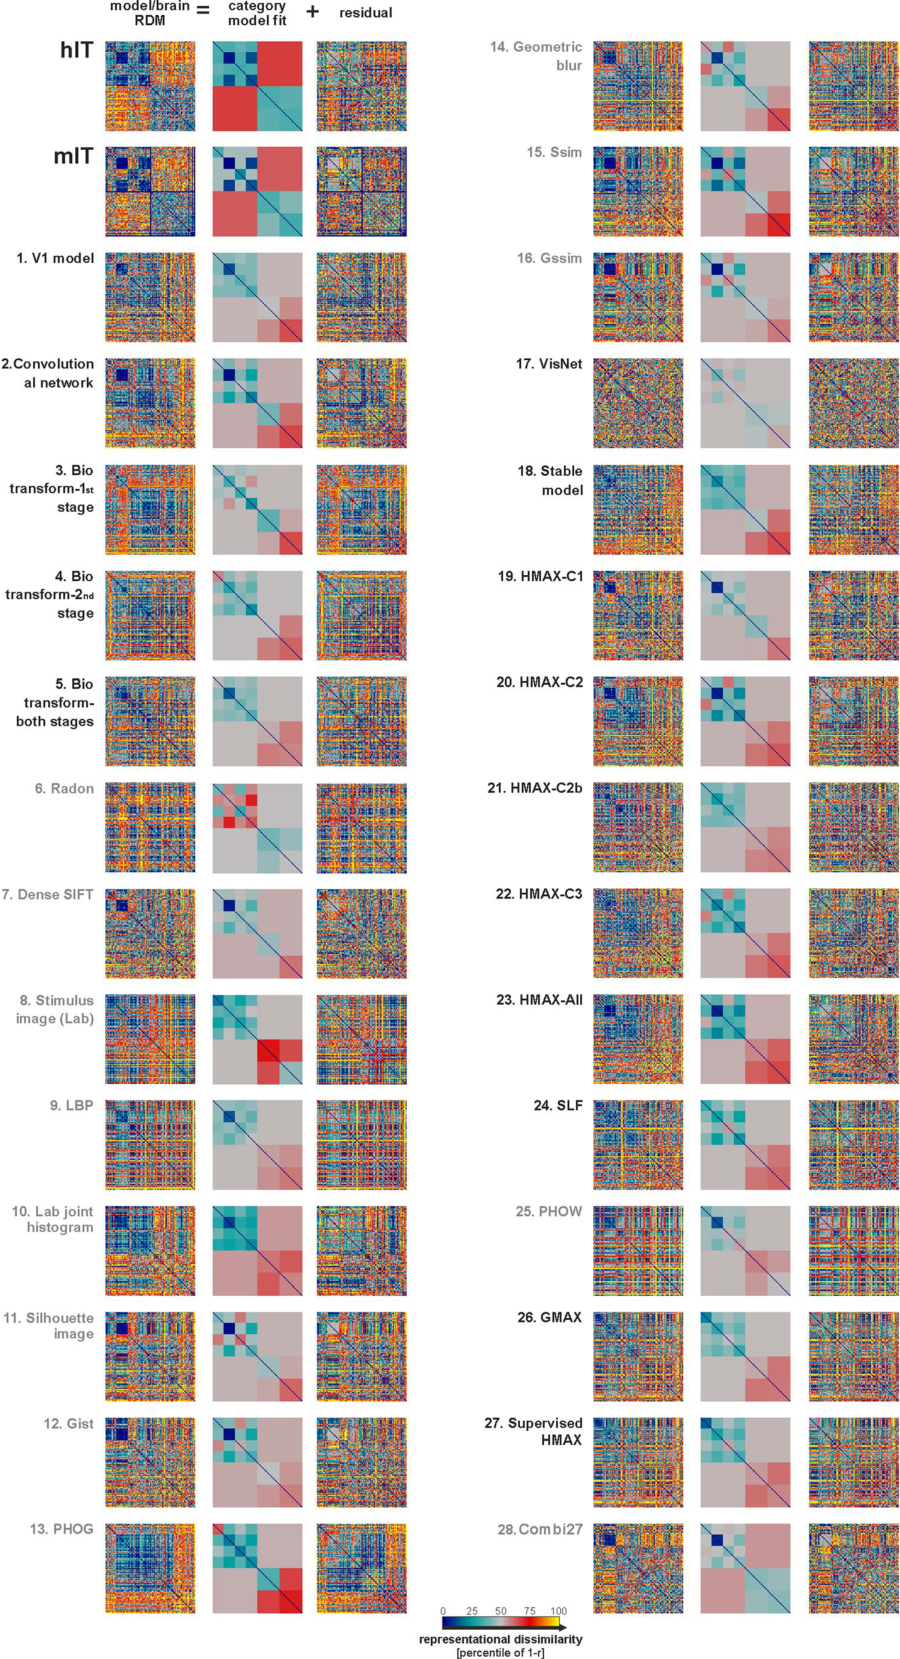
图 4 · IT 的类别性指数显著高于全部非强监督模型
原文图注:Figure 4. The not-strongly-supervised models are less categorical than IT. Categoricality was measured using a categoricality index (vertical axis) for each model and brain RDM. The categoricality index is defined as the proportion of RDM variance explained by the category-cluster model (Figure S5), i.e. the squared correlation between the fitted category-cluster model and the RDM it is fitted to. The blue (gray) line shows the categoricality index for hIT (mIT). Significant differences between the categoricality indices of each model and hIT are indicated by blue vertical arrows. Categoricality is significantly greater in hIT and mIT than in any of the 28 models.
该图展示 IT 与各非强监督模型的类别性指数(categoricality index),该指数定量衡量有生命/无生命等目标类别在矩阵中聚合的显著程度。结果显示人类与猕猴 IT 的类别性指数显著高于所有非强监督模型,模型表征主要反映图像连续底层物理特征的差异。
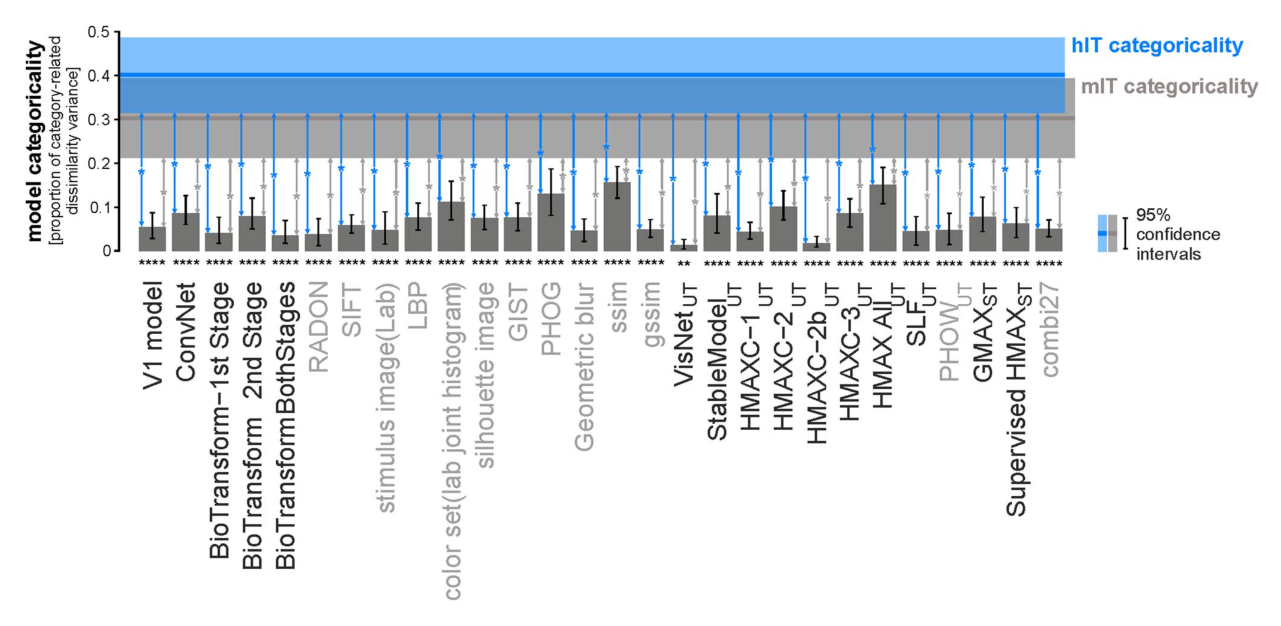
图 5 · 重混与重加权救不了非强监督模型
原文图注:Figure 5. Remixing and reweighting features of the not-strongly supervised models does not explain IT. In order to build an IT-like representation, we attempted to remix the features to strengthen relevant categorical divisions. We trained three linear SVM classifiers (for animate/inanimate, face/nonface, and body/nonbody) on the combi27 features using 884 training images (separate from the set we had brain data for).
该图展示对非强监督模型特征实施线性重构(利用支持向量机基于外部类别标签重混合与重加权)后的效果。即便经过针对类别维度的特征重组,其重构 RDM 与人类/猕猴 IT 的相关度提升仍较为有限,未能达到生物神经表征的吻合水平。
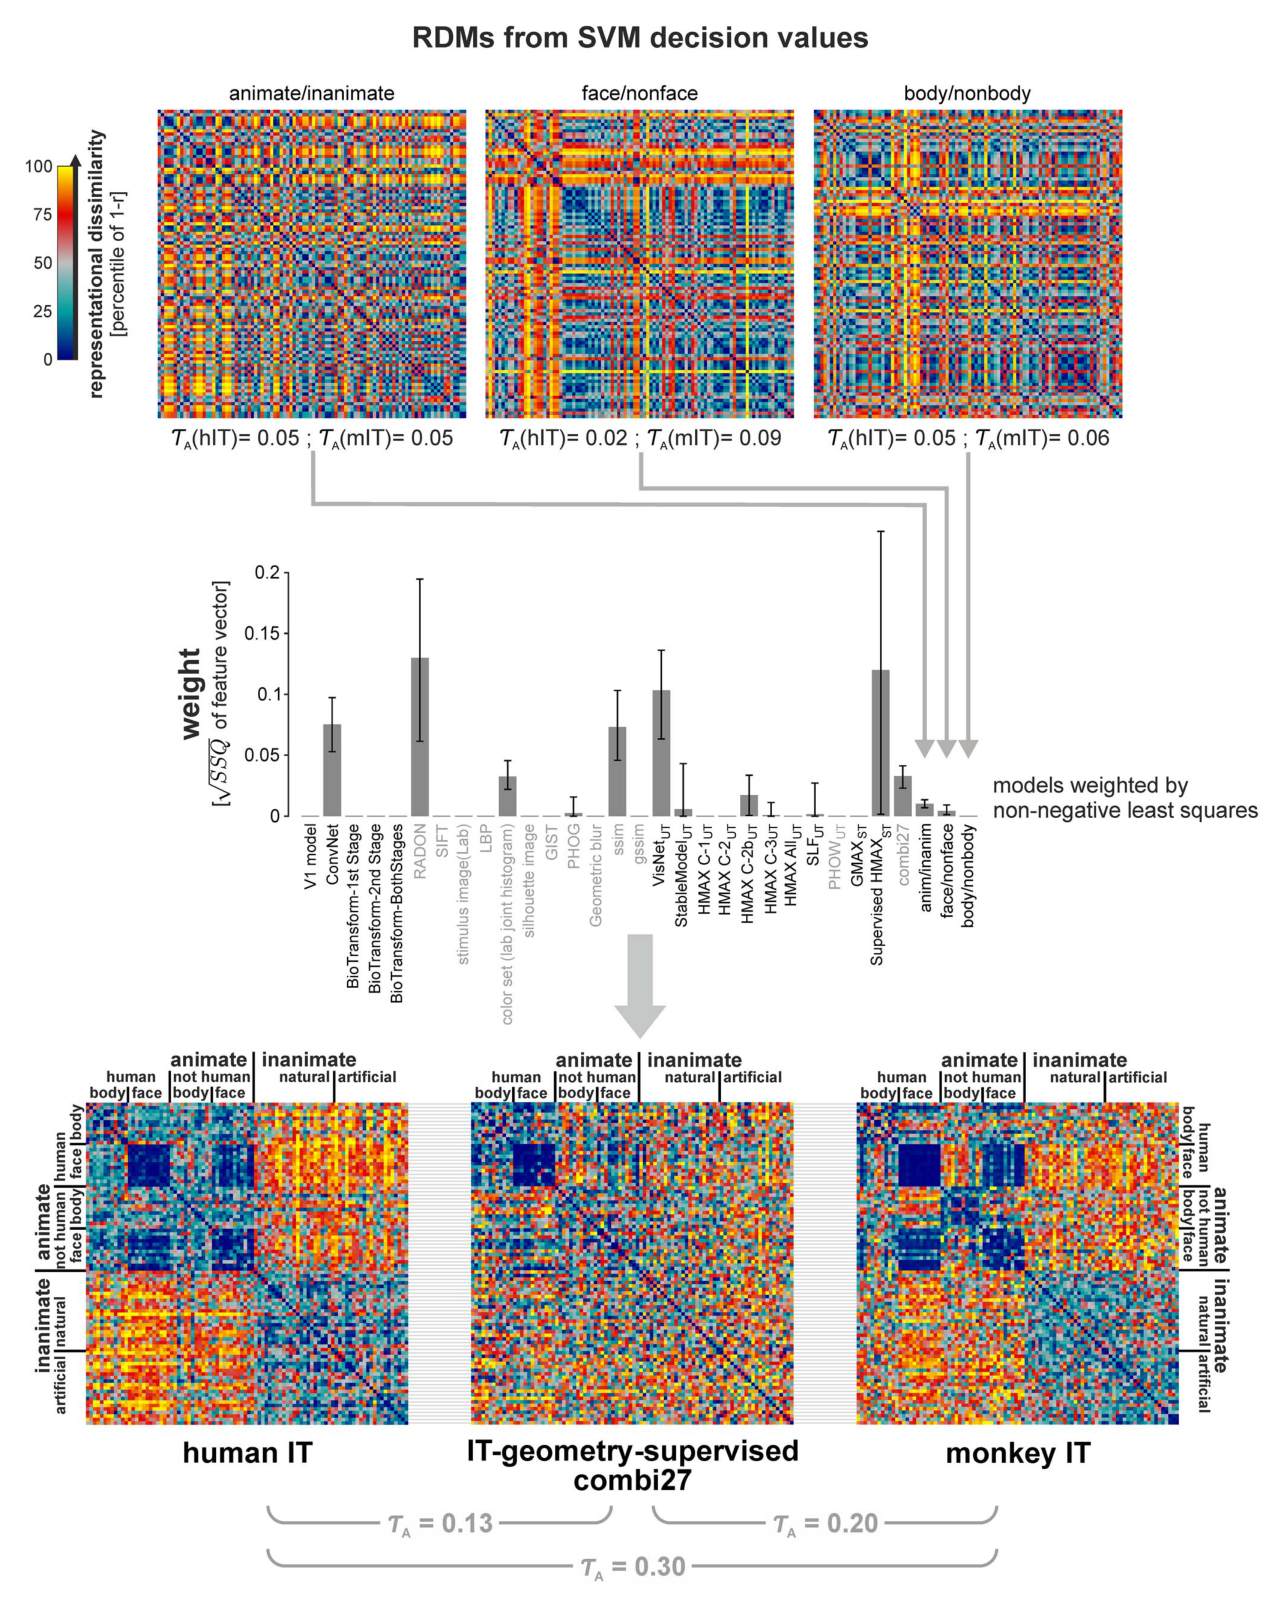
图 6 · 深度监督网络各层的 RDM 及其与 IT 的相关
原文图注:Figure 6. RDMs of all layers of the strongly supervised deep convolutional network. RDMs for all layers of the deep convolutional network (Krizhevsky et al. 2012) ref [41] are shown for the set of the 96 images (L1: layer 1 to L7: layer 7). Kendall-tA RDM correlations of the models with hIT and mIT are stated underneath each RDM. All correlations are statistically significant.
该图呈现深度监督卷积神经网络(Krizhevsky 等,2012)自底层(Layer 1)至顶层(Layer 7)在 96 幅测试图像上的表征相异度矩阵,并标注各层与人/猴 IT 的相关系数。随着网络层级加深,相异度矩阵中的结构逐渐从局部纹理主导向具有生命/非生命聚类特征的拓扑组织演进。
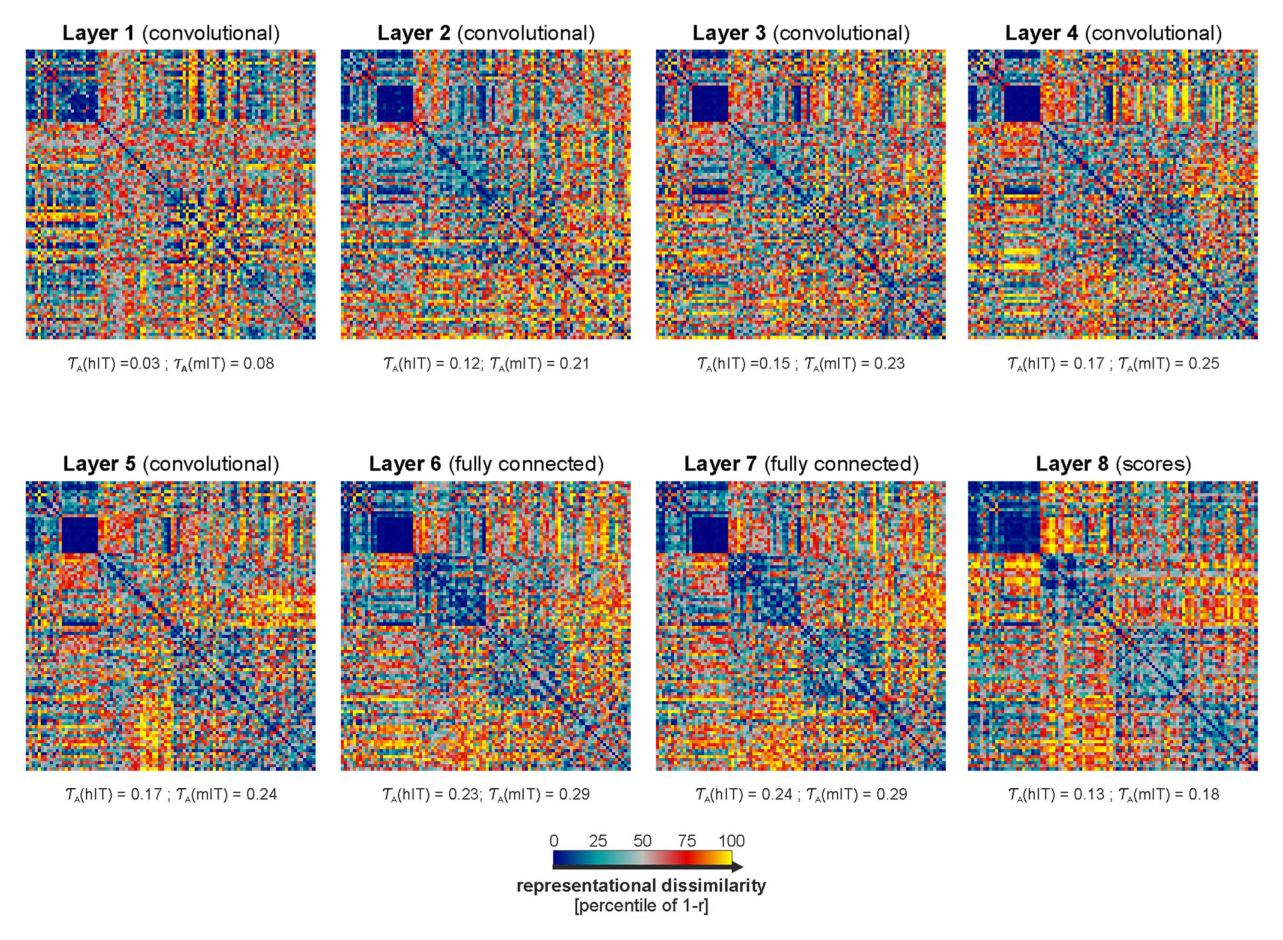
图 7 · 各层与 hIT 的相关随深度上升,最终 IT-几何监督模型触及天花板
原文图注:Figure 7. The strongly supervised deep network, with features remixed and reweighted, fully explains the IT data. The bars show the Kendall-tA RDM correlations between the layers of the strongly supervised deep convolutional network and human IT. As we ascend the layers of the deep network, model RDMs explain increasing proportions of the variance of the hIT RDM. The noise ceiling (gray bar) indicates the expected correlation of the true model (given the noise in the data). None of the layers of the deep network reaches the noise ceiling. However, the final fully connected layers 6 and 7 come close to the ceiling. Remixing the features of layer 7 using linear SVMs to strengthen the categorical divisions provides a representation composed of three discriminants (animate/inanimate, face/nonface, and body/nonbody) that reaches the noise ceiling. Reweighting the model layers and the three discriminants yields a representation that explains the hIT geometry even better.
该图绘制深度监督网络各层特征与人类 IT 的相关曲线:原始网络特征与 IT 的相关度随深度递增;在对深层特征实施线性重加权与重混合(IT-geometry-supervised)后,模型在独立测试集上的预测准确度进入了人类 IT 的噪声天花板区间(灰色阴影)。
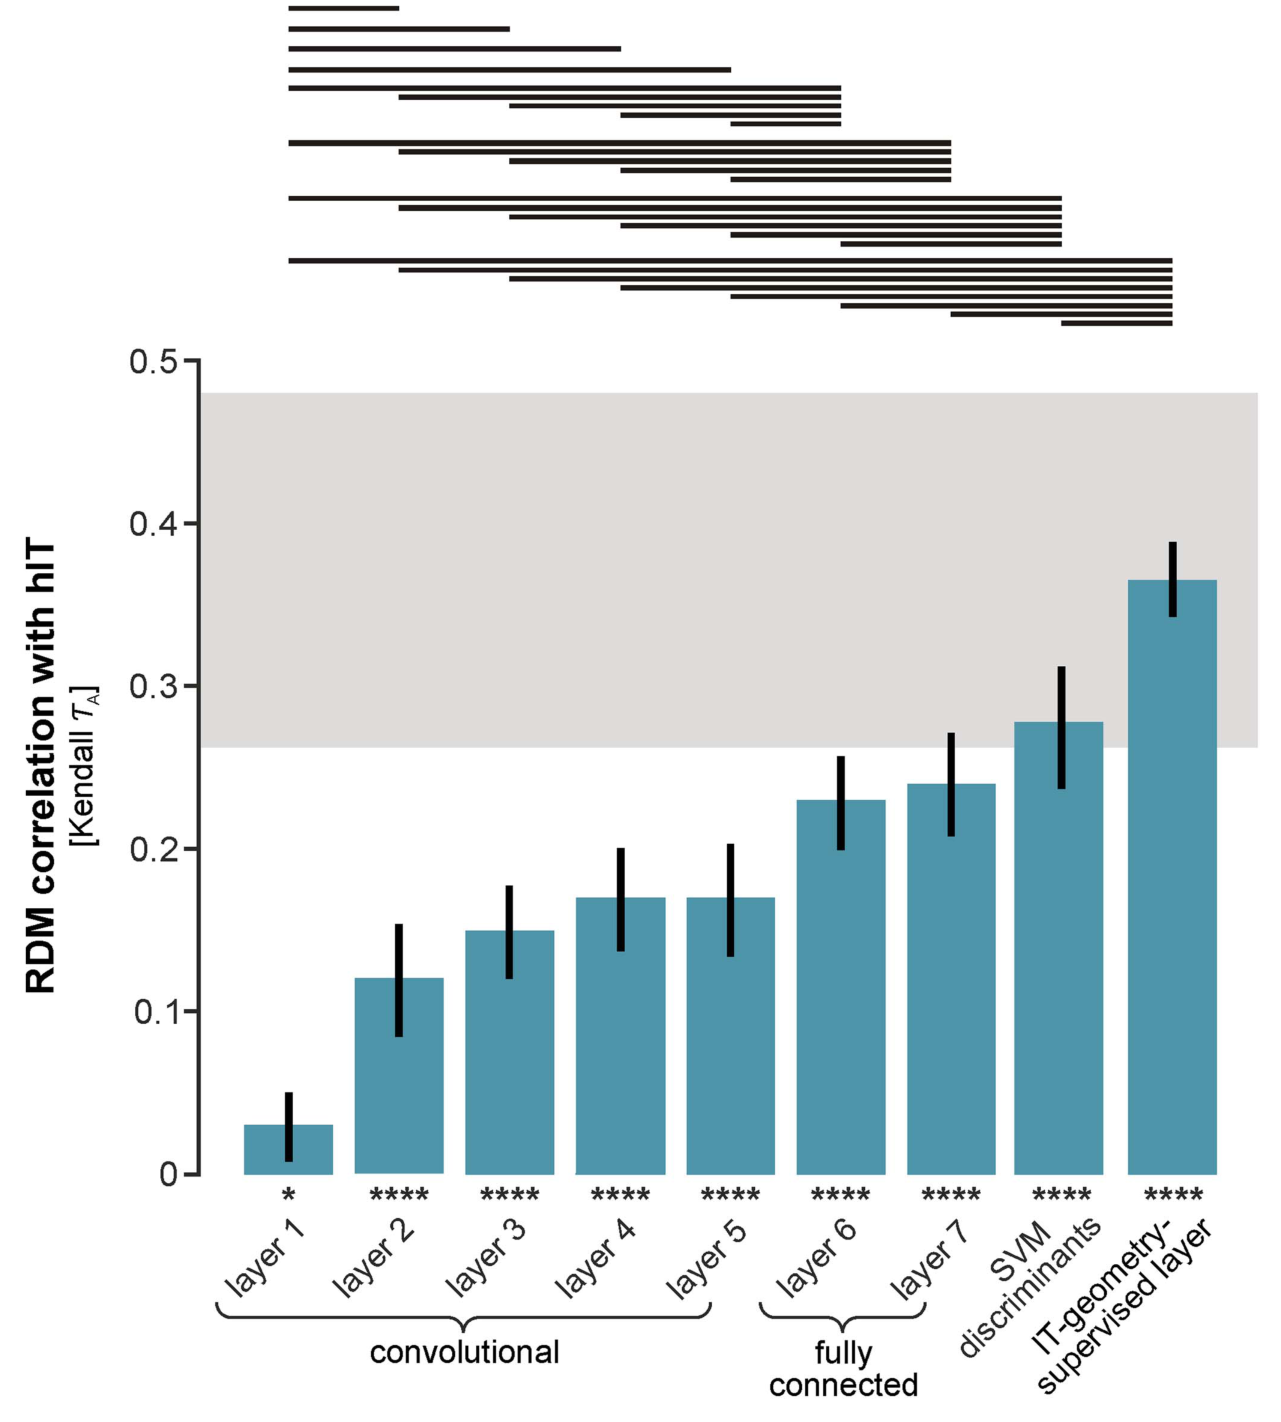
图 8 · 类别结构沿深层网络逐层浮现,重混后与 IT 相似
原文图注:Figure 8. IT-like categorical structure emerges across the layers of the deep supervised model, culminating in the IT-geometry-supervised layer. Descriptive category-clustering analysis as in Figure 3, but for the deep supervised network. The fitted linear-combination of category-cluster RDMs is shown in the middle columns. This descriptive visualization shows to what extent different categorical divisions are prominent in each layer of the deep supervised model. The layers show some of the categorical divisions emerging. However, remixing of the features (linear SVM readout) is required to emphasize the categorical divisions to a degree that is similar to IT. The final IT-geometry-supervised layer (weighted combination of layers and SVM discriminants) has a categorical structure that is very similar to IT.
该图展示深度监督网络各层的类别结构分解:与图 3 的非强监督模型对比,监督深层网络(尤其 Layer 7 及重构层)中提取出的类别成分幅度显著增加,展现出与生物 IT 高度相似的类别拓扑分离。
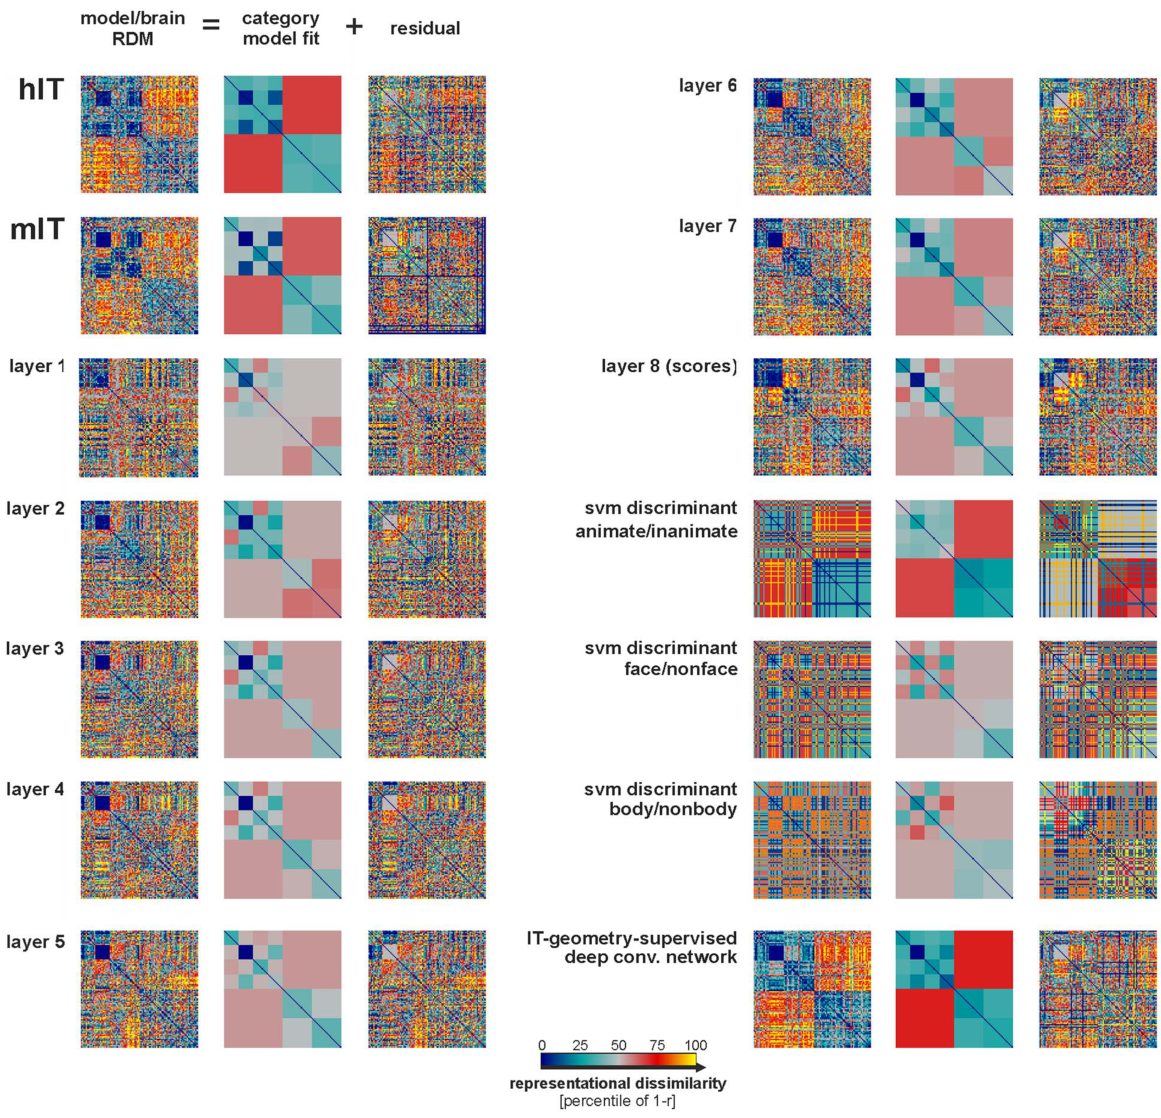
图 9 · 深层网络内部各层类别性仍不及 IT,重混加权后追平
原文图注:Figure 9. The layers of the deep supervised model are less categorical than IT, but remixing and reweighting achieves IT-level categoricality. Bars show the categoricality index for each layer of the deep convolutional network and for the IT-geometry-supervised layer. Categoricality is significantly greater in hIT and mIT than in any of the internal layers of the deep convolutional network. However, the IT-geometry-supervised layer (remixed and reweighted) achieves a categoricality similar to (and not significantly different from) IT.
该图对比深度监督网络各层的类别性指数。从浅层至深层,网络的类别性稳步上升;经过线性重混合与重加权后,模型的类别性指数完全追平了人类与猕猴 IT 皮层的水平。
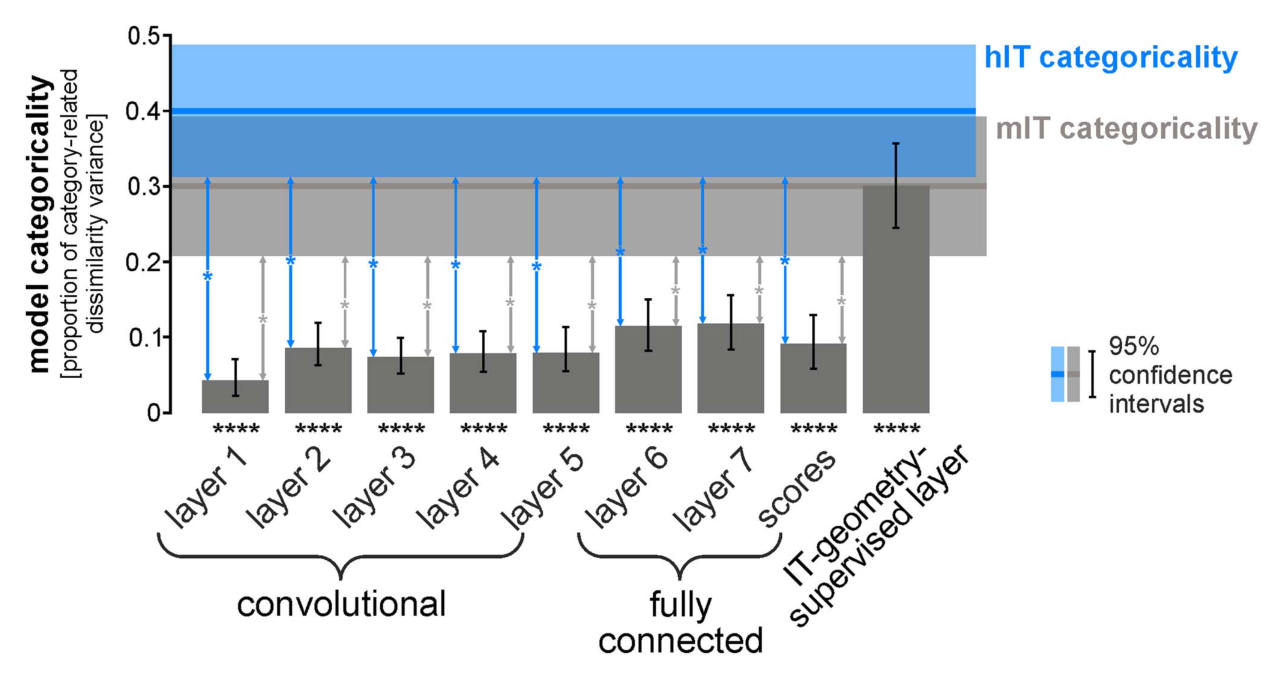
图 10 · 对深层特征重混加权,得到与 IT 几何一致的 RDM
原文图注:Figure 10. Remixing and reweighting features of the deep supervised network achieves an IT-like representational geometry. All analyses and conventions here are analogous to Figure 5, but applied to the strongly supervised deep convolutional network. Remixing the features of layer 7 by fitting linear SVMs (separate set of training images) for the major categorical divisions (animate/inanimate, face/nonface, and body/nonbody) helped account for the categorical clusters in IT. The tA RDM correlation between the fitted model and IT is about equal for monkey IT (0.40) and human IT (0.38).
该图展示深度卷积网络顶层特征经线性重构后生成的表征相异度矩阵。重构矩阵呈现出清晰的生命体与非生命体分块以及面孔亚群聚类,在拓扑结构上与实验记录的人类和猕猴 IT 矩阵高度一致。
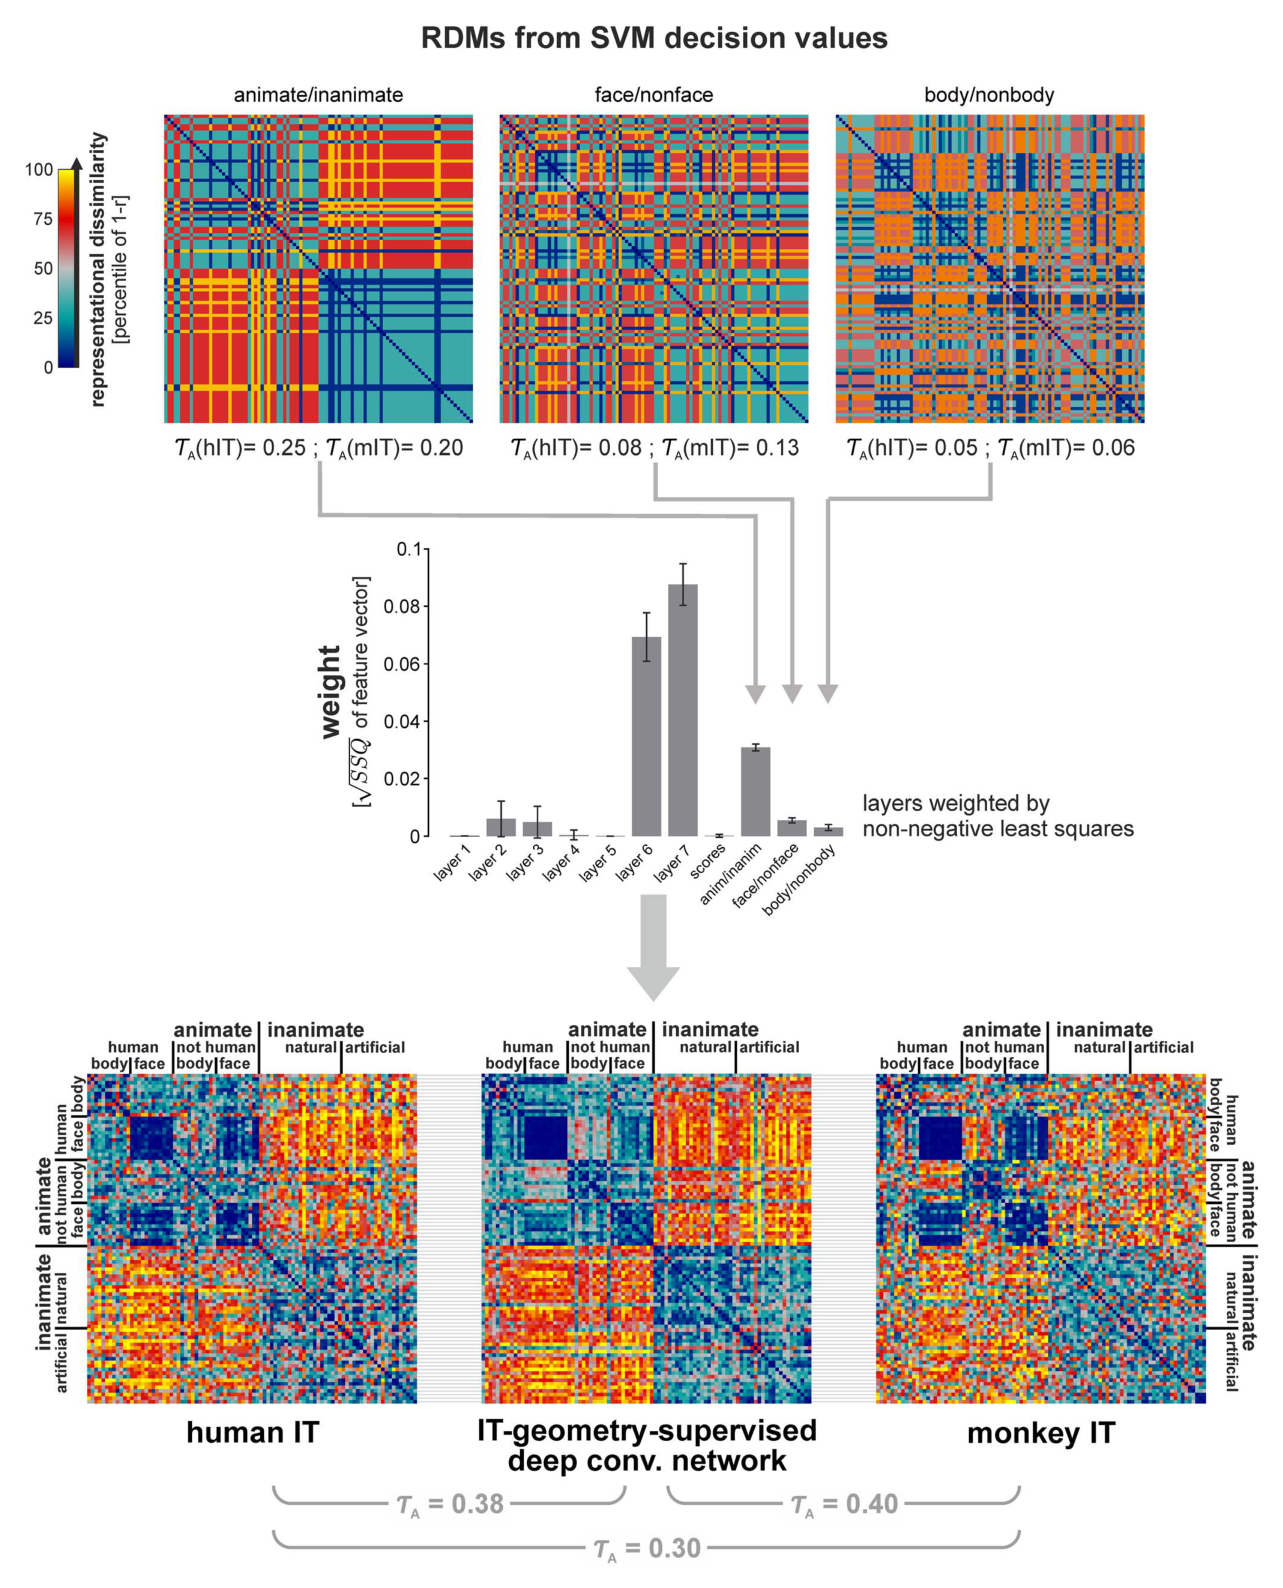
图 11 · 各模型 animate/inanimate 分类性能
原文图注:Figure 11. Animate/inanimate categorization accuracy for all models. Each dark blue bar shows the categorization accuracy of a linear SVM applied to one of the computational model representations. Categorization accuracy for each model was estimated by 12-fold crossvalidation on the 96 stimuli. Light blue bars show the average model categorization accuracy for random label permutations. The deep convolutional network model (final fully connected layer 7) has the highest animate/inanimate categorization performance (96%). The combi27 has the second highest performance (76%).
该图展示各计算模型在 96 幅图像上的二分类(有生命 vs 无生命)交叉验证解码正确率。深度监督卷积网络的顶层取得了最高的分类准确率,显著优于传统生物启发模型及未受强监督训练的底层视觉特征。
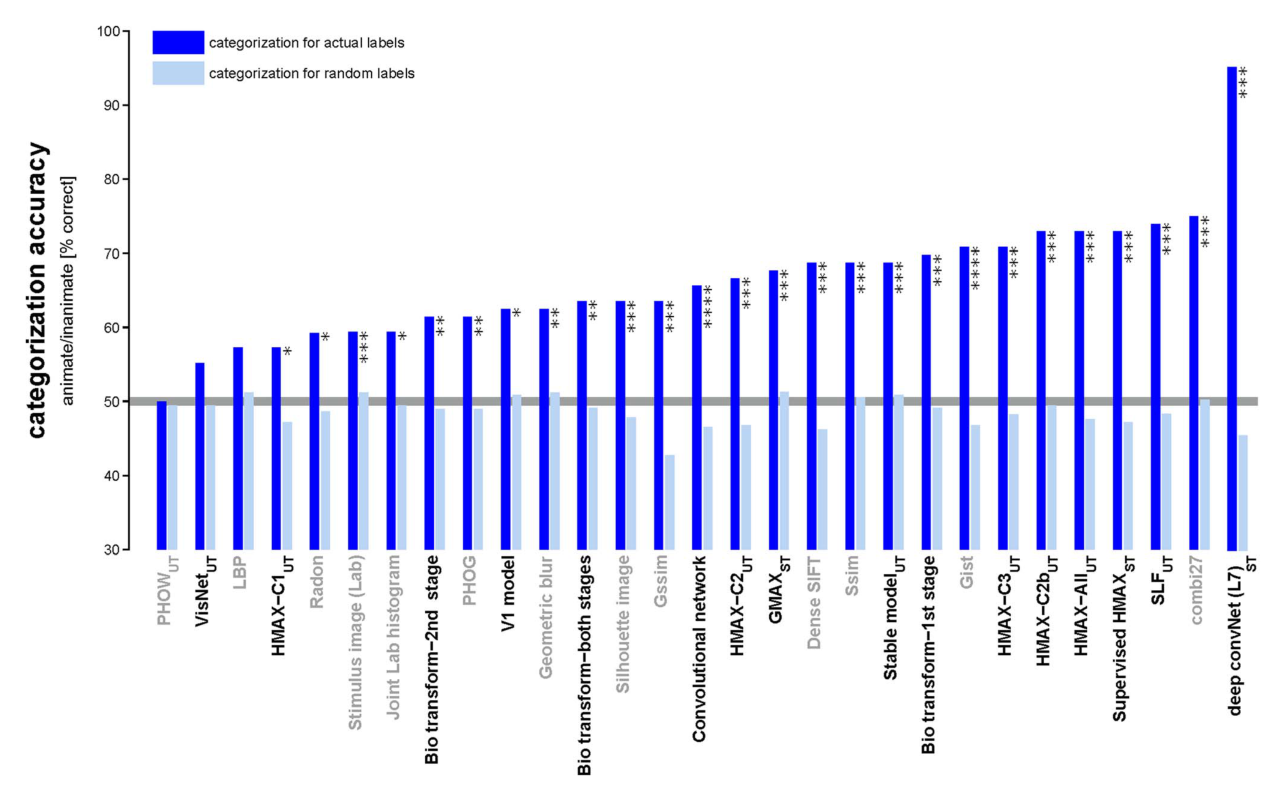
图 12 · 模型越像 IT,分类性能越好
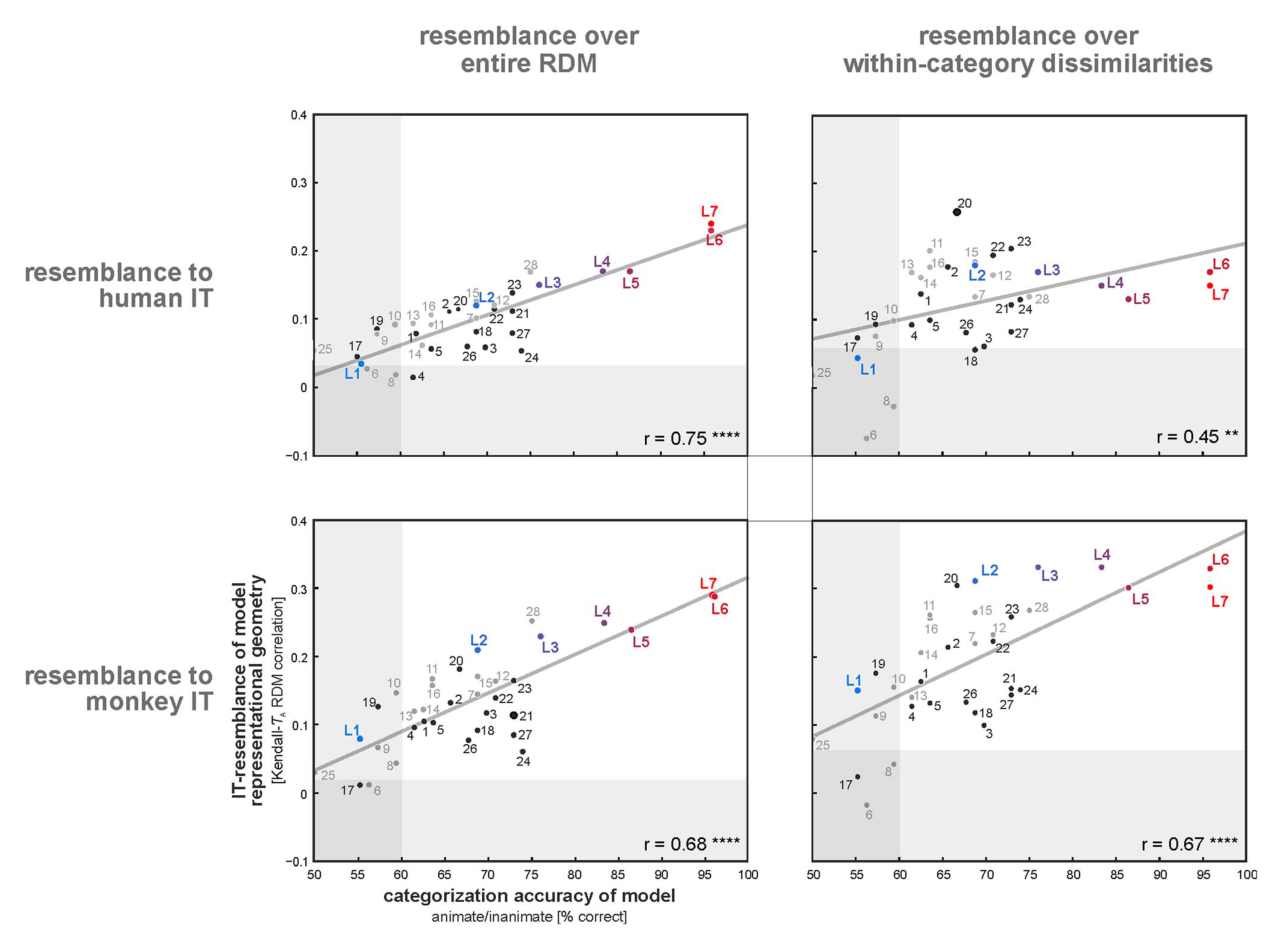
原文图注:Figure 12. Model representations resembling IT afford better categorization accuracy. A model's IT-resemblance (measured by the RDM correlation between IT and model) predicts its categorization accuracy (animate/inanimate). This holds for both human-IT resemblance (top) and monkey-IT resemblance (bottom). However, the within-category RDM correlation between a model and IT also predicts model categorization accuracy. Each panel shows the least-squares fit (gray line) and the Spearman rank correlation r. Each circle shows one of the models. Computer vision models are shown by gray circles; biologically motivated models are shown by black circles. The transparent horizontal and vertical rectangles cover non-significant ranges along each axis.
该图展示模型对 IT 表征的解释度(与生物 RDM 的相关度)与其在生命体分类任务中的解码表现之间的散点对应关系。二者呈现显著的正相关,表明能够更好支持行为分类任务的表征形式与生物高级视觉皮层的几何结构更为相符。
讨论
研究表明,深度层级架构与大规模类别标签监督学习的结合,是生成与灵长类下颞叶皮层表征几何高度一致的人工视觉特征的关键条件。非强监督模型之所以落后,不仅在于缺乏显式的分类读出器,更根本地在于其前向特征空间内部缺乏对类别不变性特征的充分提取。深度网络通过逐层非线性变换与大样本任务约束,自发形成了兼顾视觉物理属性与高级语义边界的拓扑表征。
在理论解释层面,作者指出 IT 皮层的功能定位可被理解为一种“视-语义表征”(visual-semantic representation),它连接了早期视网膜输入的物理几何与高级认知行为所需的类别结构。研究也存在明确边界:其一是测试集基于 96 幅静态白底抠图,未涵盖复杂自然背景扰动与动态视觉流;其二是达到噪声天花板并不等同于人工网络与生物神经回路在微观突触连接或神经动力学上完全等价,宏观表征几何的相似反映的是任务约束与层级架构共同塑造的高维空间计算同构。
一句话总结
该研究在统一的表征相似性分析框架下系统评测了 37 种视觉计算模型,证实仅依靠无监督或弱监督机制难以自发产生灵长类下颞叶的高阶类别表征几何,而大规模目标分类监督训练的深度卷积网络展现出与生物 IT 高度吻合的表征结构,为解析高级视皮层的计算机制提供了明确证据。