一句话定位:该研究通过皮层冷却(cortical cooling)可逆阻断猕猴腹侧视通路中背侧 V4 或 V2/V3 输入,同步记录后部下颞叶皮层(PIT)微电极阵列群体活动,结合群体解码、状态空间几何与层级前馈模型,解析了并行输入通路对高级形状编码的差异性贡献。
研究背景
灵长类腹侧视觉通路常被描述为从初级视皮层(V1)经 V2、V4 到下颞叶皮层(IT)的逐级层级网络。然而解剖学研究表明,该系统包含大量越级与并行投射:V1 可直接投射至 V4,V2 与 V3 亦可直接投射至后部下颞叶皮层(PIT)。这些并行旁路与串行主干并存,可能起到提供互补表征、缩短传导时间或增强系统鲁棒性的作用。
慢性损伤或物理切除实验虽能揭示特定视区对识别行为的必要性,但难以排除长期代偿重塑的影响;同时,平均放电率的变化仅反映兴奋性驱动强度,无法直接说明神经元群体对图像区分度(表征能力)的改变。因此,需要在可逆且急性干预的条件下,结合多通道电生理记录与多元模式分析,系统评估各上游视区对下游形状选择性与群体编码精度的即时贡献。
该研究在两只猕猴的背侧 V4 与 V2/V3 分别植入冷冻环,并在下游 PIT 植入微电极阵列,测试冷却前后 PIT 神经元对多类复杂图像的反应变化。结合支持向量机解码、高维状态空间旋转分析与带跳跃连接的 HMAX 模型,评估各通路的贡献特征。需说明的是,冷冻环仅覆盖局部视网膜对应区(暗点覆盖数度),且视皮层间存在广泛相互连接,所得结论受限于实验刺激样本与视野覆盖范围。
研究思路
实验利用可逆皮层冷却技术,在同一记录 session 内依次实施“基线常温 → 冷却 V4 → 复温 → 冷却 V2/V3”。由于冷却任一视区均阻断了经典主干通路(V1→V2→V4→PIT),两种冷却状态的对比可用于评估经由 V4 或 V2/V3 的输入对下游表征的不同影响。
在数据分析上,研究超越了单一放电率统计,引入基于线性 SVM 的群体解码精度;通过高维活动空间的投影分解,将反应变化分解为平行于基线响应的“增益/缩放分量”与垂直于基线的“表征旋转分量”;并建立具有并行通路的改进 HMAX 模型,对比生物数据与前馈计算网络在旁路损伤下的鲁棒性表现。
方法
被试为 2 只成年雄性猕猴(10–17 kg),训练完成注视任务:盯住 0.5° 红色方块(±1.3° 窗口),每 200 ms 亮/灭交替呈现中央凹旁图像,每试次 3–5 张。刺激共 293 张、15 类:简单线形(直线、折角、十字、曲线、三星、径向与线性 Gabor、复合角)与复杂类别(动物、人造物、身体部位、面孔、地点、植物/食物等),另用 Portilla–Simoncelli 纹理模型生成 118 张保留原图低阶统计的 scrambled 纹理;图像最长轴 1.4°(猴 G)或 2.0°(猴 R),未做亮度归一。每只动物每天一个 session(每只共 6–8 天):先在 36–37°C 体表温度收集约 5 次重复/图像,然后开启 cryoloop(管内 9–11°C,使邻近皮层降至 16–18°C)再收集 5 次,复温 10 分钟后做第二轮冷却,两种冷却顺序跨天平衡。PIT 阵列为 32 通道铂铱漂浮电极(猴 R 两片、猴 G 一片 32 通道加两片 16 通道),仅分析有视觉驱动反应的通道(38/64 与 30/64)。
分析时窗:基线 0–50 ms、早期 51–150 ms、全窗 51–400 ms,反应幅度取早期减基线;每通道逐 session 做 z 分数标准化,再把不同天的通道堆叠成"伪群体"(100–300 个多单元位点)。行为上先用闪烁小图在 16×16° 径向网格上绘制阵列覆盖的聚合感受野,再把冷却条件减去对照条件得到暗点(scotoma)范围——结果暗点偏向下方近中央凹视野,与背侧 V2/V4 视网膜拓扑预测一致(V4 冷却暗点 6.7°²/7.5°²,V2|3 冷却 9.1°²/5.7°²,两猴同一中心位置;后续刺激尺寸都放进两个暗点的重叠区)。解码用线性核 SVM 的一对一方案:每对图像训练一个分类器、留一法交叉验证,并用打乱标签的 SVM 估计机会水平(小样本下机会值偏离 0.5,故所有精度都减去打乱标签基线);类别比较改用五折交叉验证。投影分析把每张图在冷却时的群体向量位移 t 分解为平行于最小反应向量 v_min 的增益分量与垂直的旋转分量;选择性用 F 统计量(组间/组内方差比)逐通道计算并做 bootstrap 斜率检验。模型部分基于 Serre et al. (2007b) 的标准模型(HMAX 家族),改为四层三通路:主干 V1→"V2|3"→"V4"→"PIT",旁路一 V1→"V4"→"PIT"(跳过 V2),旁路二 V1→"V2|3"→"PIT"(跳过 V4),顶层 58 个"PIT"单元(4 个主干、25 个仅 V4 旁路、25 个仅 V2 旁路、4 个混合输入),旁路层感受野尺寸四倍放大,并用猴眼动分布模拟注视微动(每图 6 个位置变体)以引入变异性,共训练 6 个不同感受野配置的模型。
主要结果
- 皮层冷却部分降低 PIT 诱发反应,两通路放电率降幅无显著差异(图 1、2,表 1、2):视野暗点测绘确认冷却局限于 V2/V3 或 V4。视觉驱动通道的放电率在 V4 冷却下降 27%(猴 R)与 30%(猴 G),V2/V3 冷却下降 32% 与 26%;两者之间放电率降幅无统计显著差异。
- 群体解码精度显示 V4 通路对形状辨别贡献更大(图 2c、3):SVM 图像解码精度(扣除随机基线)在对照条件下为 0.24(猴 R)与 0.27(猴 G);V4 冷却使解码精度降至 0.16(两猴均值),而 V2/V3 冷却降至 0.20(两猴均值),V4 冷却引起的解码损失显著大于 V2/V3 冷却(P < 0.05)。
- 群体活动空间位移以旋转(表征重塑)为主而非纯粹增益缩放(图 4):将状态空间轨迹分解后,垂直分量(旋转角度)显著大于平行分量(增益),且 V4 冷却诱发的旋转分量显著大于 V2/V3 冷却(猴 R 9.1° vs 6.8°,猴 G 7.2° vs 5.3°;P < 0.001)。
- 单通道形状选择性下降与局部暗点重叠度相关,V4 冷却下降幅度更深(图 4c、d):针对图像的方差分析 F 统计量斜率在两类冷却下均显著小于 1,且 V4 冷却的斜率下降幅度大于 V2/V3 冷却(V4: 0.64/0.53;V2/V3: 0.82/0.79;P < 0.05)。
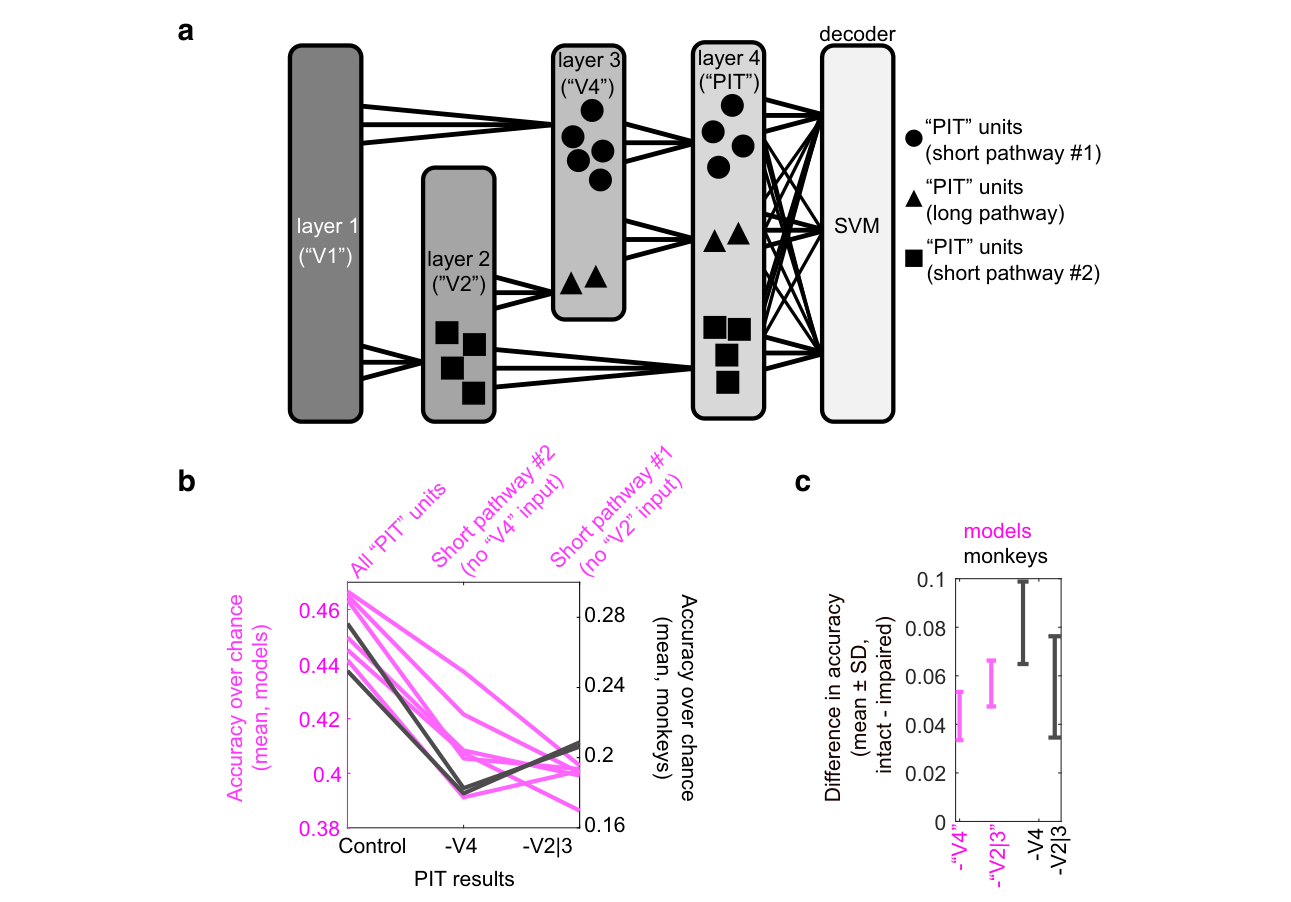
- 计算模拟与模型对比揭示表征几何扰动是解码下降的主因(图 5、6):对对照群体向量的人工扰动模拟显示,纯增益衰减对 SVM 解码精度的影响极小,而微小的空间旋转即可显著降低分类表现;带并行旁路的 HMAX 模型在模拟损伤后表现出与灵长类数据相近的鲁棒性(精度下降 5–6% vs 生物数据 5–8%)。
图注解读
图 1 · 冷却装置与暗点定位
原文图注:Figure 1. Cooling affected portions of the aggregate PIT receptive fields. a, Partial input network to PIT. b, Schematic showing location of cryoloops (purple) and microelectrode arrays (green) relative to the prelunate gyrus (yellow) and lunate sulcus (pink). Monkey R had two short loops inside the lunate sulcus. Monkey G had one long loop. c, Composite image showing the superimposed thermal and visible light images taken intraoperatively while the prelunate gyrus loop is active. d, Average firing rate for all units, evoked by flashing stimuli within a 8°×8° grid, in the control (warm) condition. Red boxes represent the regions of stimulus presentation in subsequent experiments. e, Difference in activity during cooling of area V4 (left column) or V2|3 (right column).
图示建立实验空间架构:a 展示主干与旁路连接关系;b 标明冷冻环与电极阵列在月状沟和月前回的解剖定位;c 通过热成像展示局部冷却范围限制在冷冻环周边 1–1.5 mm 内;d 呈现视野暗点与 PIT 感受野的重叠范围。
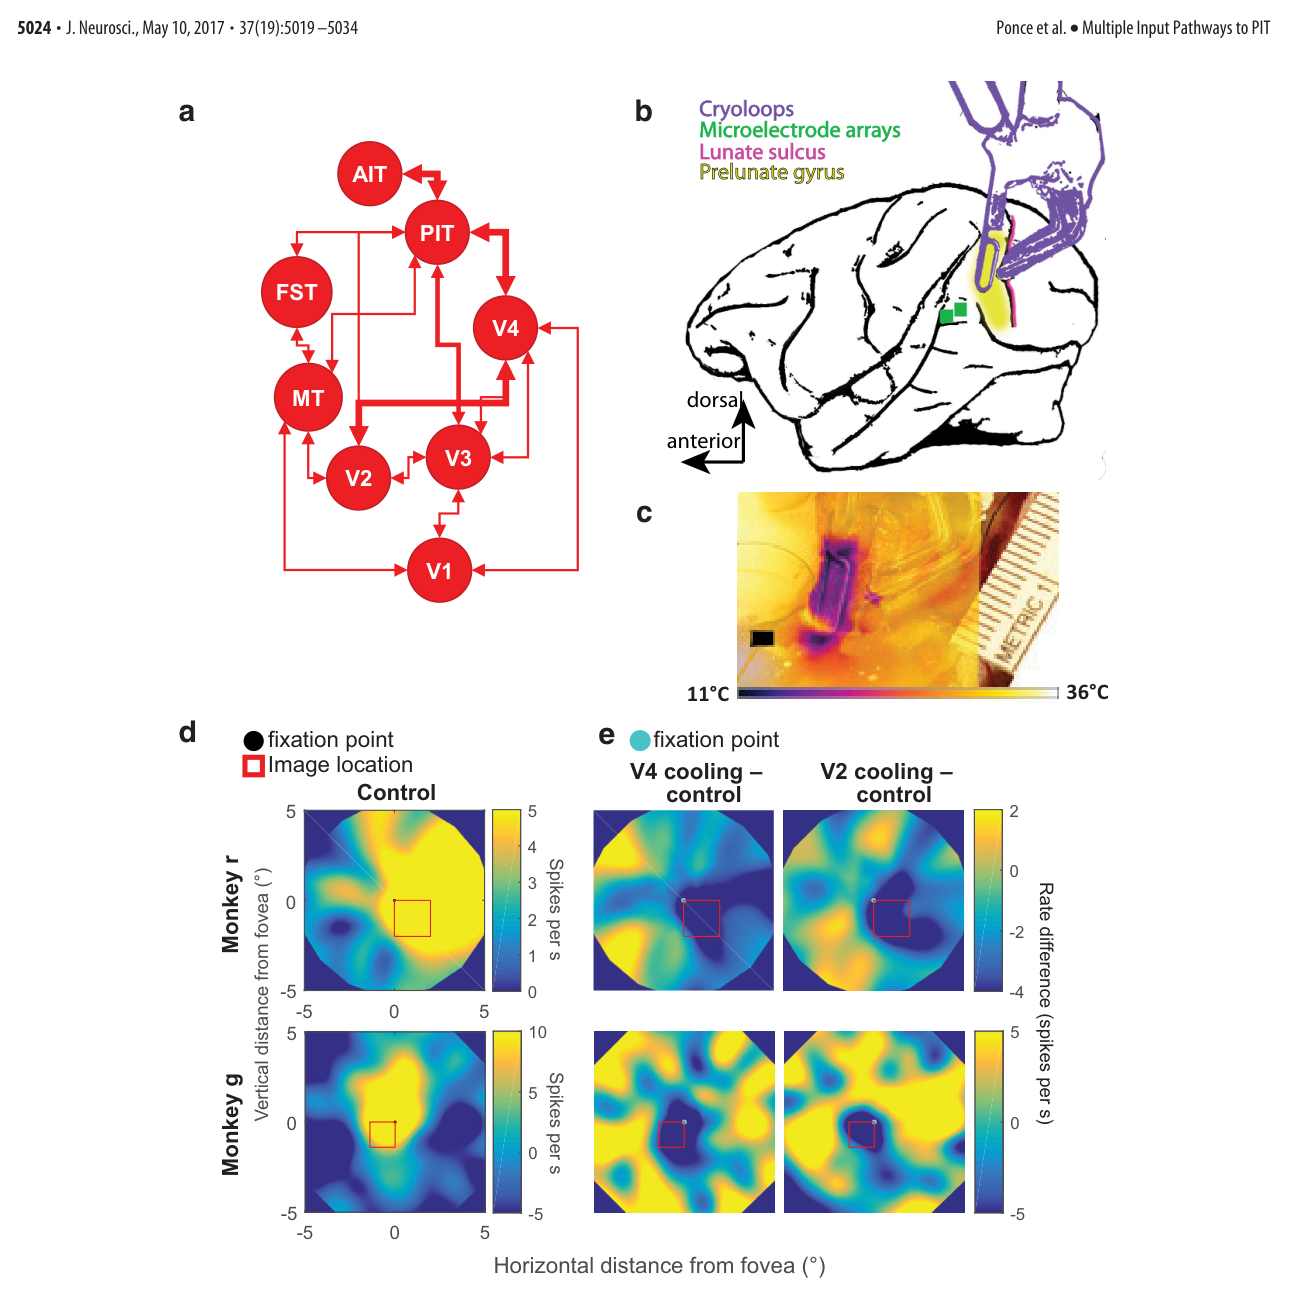
图 2 · 冷却降低放电率与分类精度
原文图注:Figure 2. Effects of cooling on firing rate and classification accuracy. a, Top, Data from one cooling session (Monkey R, day 1). The evoked spike rates from 41 visually responsive PIT sites (rows) recorded concurrently before, during, and after cooling of V4 and V2|3. Each column represents one image presentation. Solid lines indicate the onset of each cooling condition. Broken lines indicate the onset of the rewarming periods. Bottom, Mean firing rate across each temperature condition. b, Top, Average firing rate activity (z scored) for all channels during each temperature condition. Bottom, Median classification accuracy for all images during each temperature condition. c, Mean accuracy for each image before and during cooling (baseline-corrected; magenta represents control, green represents V4 cooling, blue represents V2|3 cooling). The x-axis indicates all 293 images.
图示冷却对单通道放电与群体解码的影响:a 展示单通道在常温、冷却与复温过程中的光栅图与放电率变化;b 汇总各温度条件下标准化放电率与群体解码精度的中位数,显示冷却期间放电率与分类精度的可逆下降。
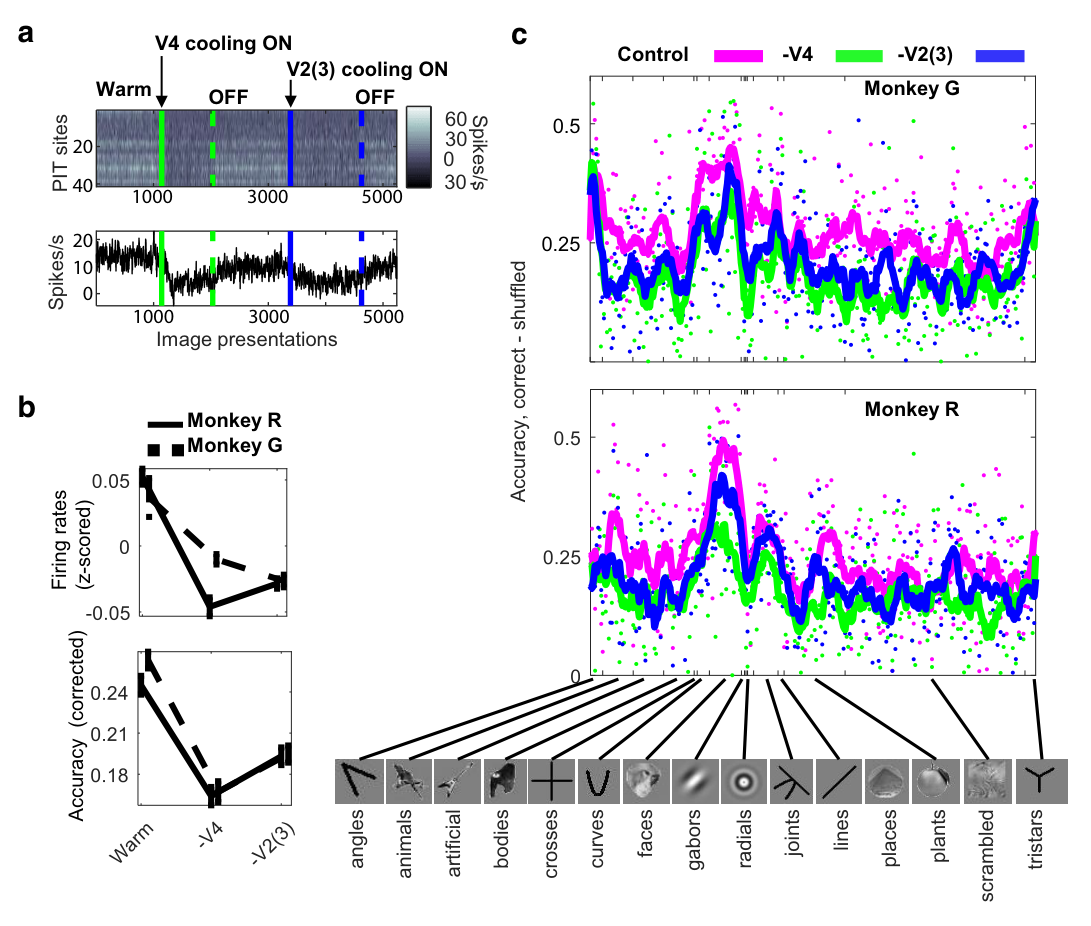
图 3 · 活动空间中的类别领土迁移
原文图注:Figure 3. Effects of cooling on categorization. a, Two-dimensional plot of activity space for Monkey G, pseudopopulation 2. Top, Control (warm) data. Middle, V4 cooling. Bottom, V2|3 cooling. b, K-means clustering of points in a, using three centroids. c, Tracking the location of two images. Faded images represent the control 2-D plot. The two saturated images are tracked before cooling (red dot), during V4 cooling (green dot), and during V2|3 cooling (blue dot). d, Fraction of images changing centroid labels during cooling (green represents V4 cooling; blue represents V2|3 cooling; solid lines indicate Monkey R; dashed lines indicate Monkey G), as a function of the number of centroids. Error bars indicate mean±SE after 100 K-means repetitions. Asterisks indicate if the difference in fractions between ΔV4 and ΔV2|3 conditions have ≤0.05 probability of arising from the same distribution (randomization test). e, Category classification accuracy before cooling (magenta), during V4 cooling (green), and V2|3 cooling (blue).
展示高维群体活动空间中的类别结构变化:a 利用多维尺度分析(MDS)将群体响应投射至二维平面;b、c 展示基于 K-means 质心的聚类追踪;d、e 呈现图像类别迁移比例与各分类解码精度,显示 V4 冷却引起的空间几何扰动显著大于 V2/V3 冷却。
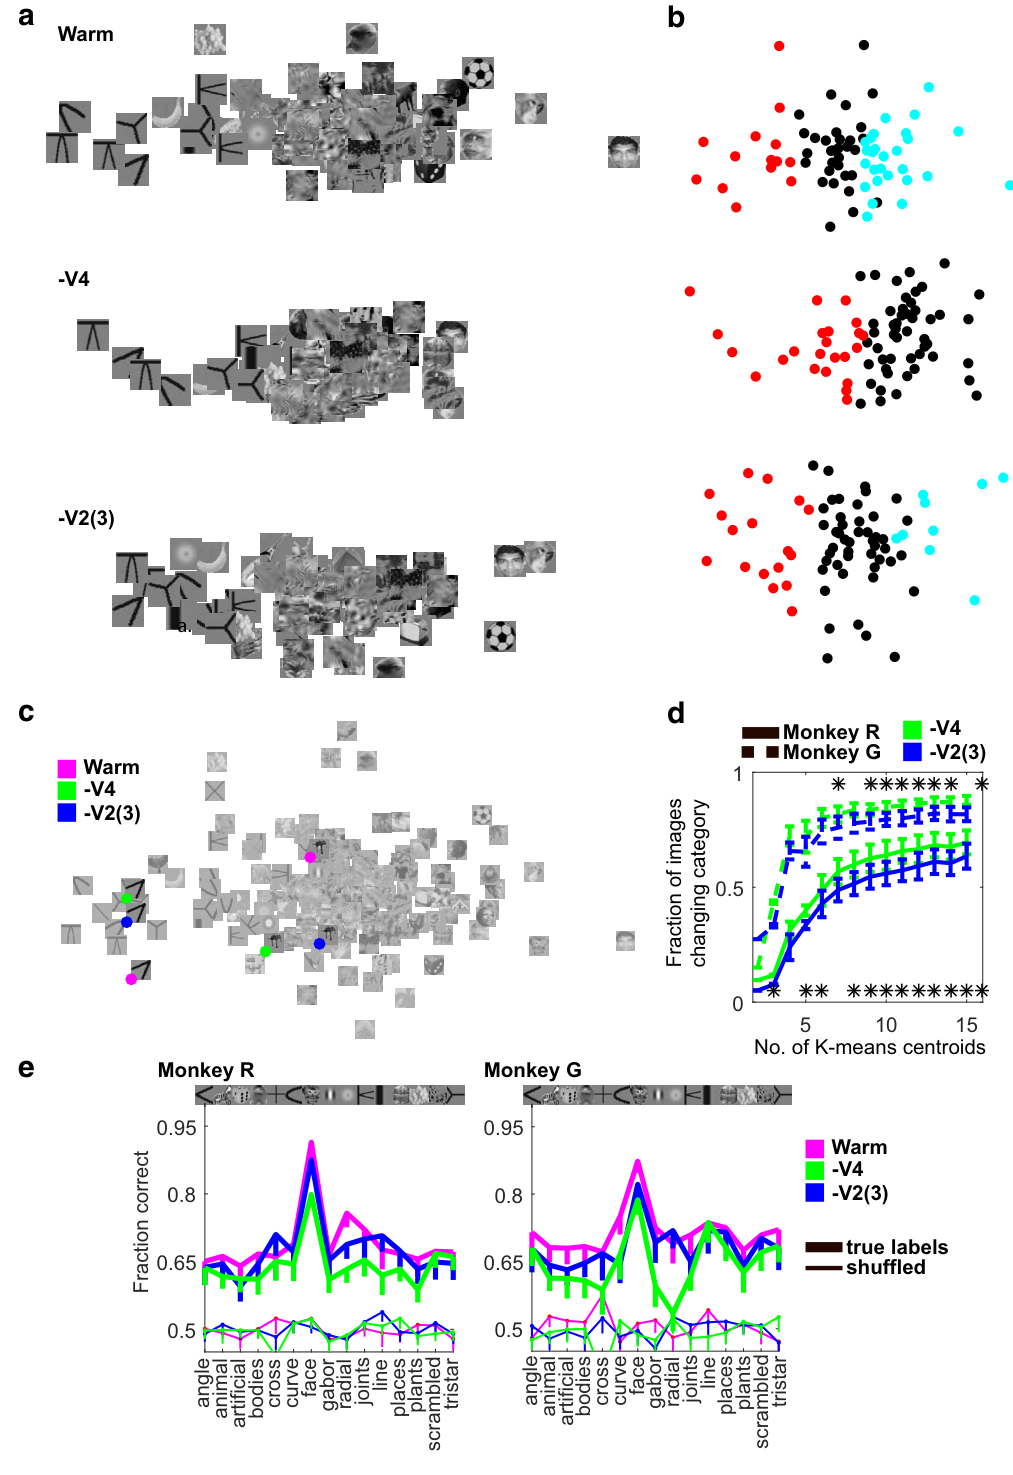
图 4 · 冷却轨迹的投影分解与单点选择性
原文图注:Figure 4. a, Projection analysis. Schematic. The axes represent the hypothetical responses of two units in response to multiple presentations of a single image i before cooling (black dots) and during cooling (blue dots). The mean responses to the image are noted by v_i^warm (control) and v_i^cool (cooling). Thick black line indicates the axis between the mean control response and the minimum response vector v_min. Blue line indicates the trajectory vector t_cool between v_i^warm and the mean cooling response v_i^cool. Orange and purple lines indicate the parallel and perpendicular components, respectively, of the cooling trajectory vector. b, Mean parallel and perpendicular components of the cooling trajectory vectors for each deactivation condition and monkey. c, Scatter plots of F statistics (green represents warm vs ΔV4; blue represents warm vs ΔV2|3). Dashed black line indicates unity. d, Differences in slopes expected given a mixed temperature distribution.
展示群体反应向量的投影分解与选择性分析:a 示意图将反应向量变化分解为平行分量(纯增益)与垂直分量(空间旋转);b 展示垂直旋转分量显著高于平行分量;c、d 展示单通道选择性 F 统计量斜率的对比及置换检验分布。
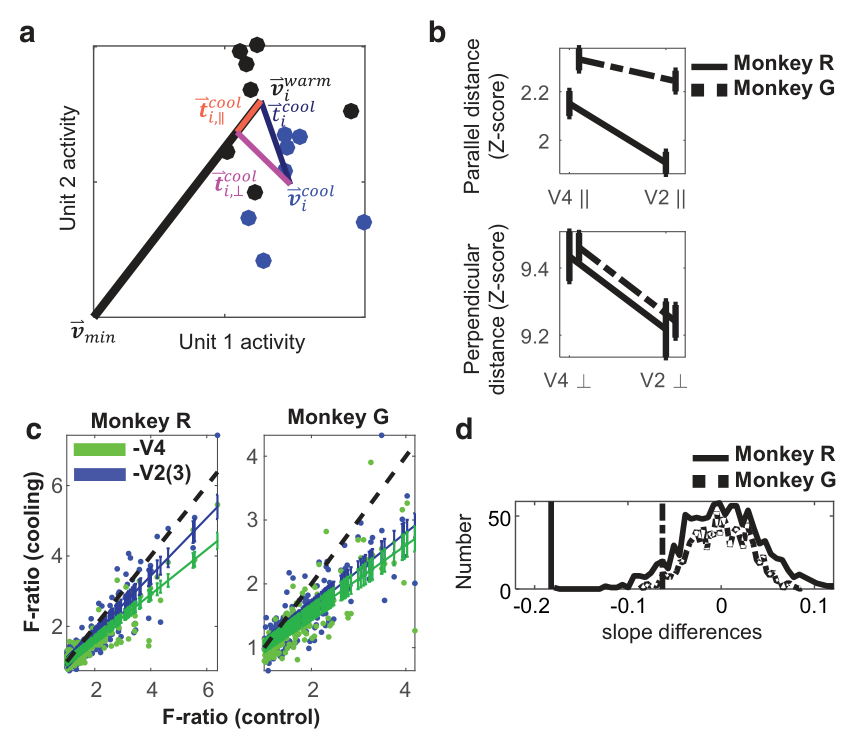
图 5 · 冷却效果的模拟梯度
原文图注:Figure 5. Cooling simulations. a, Vector rotations in N-dimensional space. ai, Hypothetical responses of two units (axes) to three different image presentations (v_i, where i = 1–3) during control conditions; v = mean response vector (asterisk). aii, Difference vectors d_i between mean response vector v and each individual image representation v_i. aiii, Perpendicular components d_i⊥ of difference vectors d_i. aiv, Rotated vectors v_i^rotated obtained after adding d_i⊥ multiplied by scalar factors to v_i. b, Decoding accuracy gradient. Mean accuracy values (baseline-subtracted, ±SE) computed after transforming warm-condition response vectors by various norm (gain) and angular changes. Green and blue circles represent the experimentally measured accuracy values during V4 and V2|3 deactivation.
展示高维空间扰动的模拟结果:a 演示在保持自然流形约束下旋转群体向量的算法;b 展示横轴为旋转角度、纵轴为增益衰减的解码精度等高线图,显示解码表现主要取决于旋转角度而非增益大小。
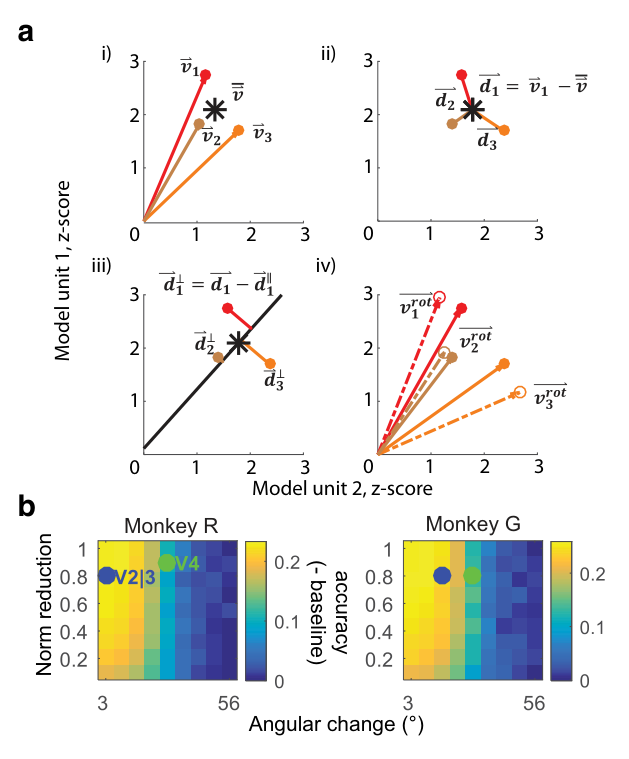
图 6 · HMAX 三通路模型对照生物数据
原文图注:Figure 6. Computational approach to testing units with different input histories. a, Architecture of our HMAX implementation, which included three parallel pathways resulting in three top layer units with different input histories (circles, triangles, and squares). SVMs were used to query each population independently or as a whole group. Six different models were trained with the same architecture but different RF shapes. b, Mean classification accuracy over chance (±SEM) for both animals during the warm, V4 and V2|3 deactivation (black) and for all simulated PIT populations in six models (pink). The label "All 'PIT' units" describes results from querying the full population of short-and long-pathway PIT cells. c, Differences in classification accuracy shown in b, for different implementations of the model and monkeys. "Intact" refers to the "All 'PIT' units" condition in the model implementations and to the precooling condition in the monkeys. "Impaired" refers to the queried subpopulations in the model and to the cooling conditions in the monkeys.
展示改进前馈 HMAX 模型的结构与性能对比:a 模型架构包含完整主干及跳过中间视区的并行旁路;b、c 对比生物数据与模型在不同通路失活条件下的解码精度降幅,验证了并行旁路结构对局部损伤的计算鲁棒性。
讨论
讨论指出,阻断单一视区仅部分削减 PIT 活性的原因在于 PIT 具有广泛且冗余的解剖投射来源(涵盖 V3A、V4t、LIP、MT 以及皮层下丘脑枕核等多重输入)。解剖学逆行追踪显示 V4 投射至 PIT 的神经元数量显著多于 V2,这解释了为何 V4 阻断引起更显著的表征空间旋转与解码损失。而在特征偏好分析中,研究未能找到区分两条通路功能的特定图像几何参数,表明两条通路主要在视网膜拓扑尺度与连接数量上存在差异,传递相似类型的形状表征基元。作者进一步结合深度残差网络(ResNet)讨论了并行跳跃连接在人工前馈网络与生物视通路中提高计算鲁棒性的普遍机制。
一句话总结
该研究借助可逆皮层冷却证实灵长类后部下颞叶皮层综合利用来自 V4 与 V2/V3 的并行输入进行形状编码,表明 V4 通路在群体表征中占据更大权重,且多通路并行架构赋予了高级视皮层抵抗局部传入损伤的结构鲁棒性。