一句话定位:该研究采用猕猴全脑功能磁共振成像(fMRI, functional magnetic resonance imaging),系统定位编码新近习得图像价值的神经回路。结果表明,常被视作价值编码关键脑区的眶额叶皮层在测试中几乎未检测到图像价值信号,而内侧额叶皮层则显示显著的价值激活,为跨物种价值定位争议提供了直接数据,并显示下颞叶等早期及高级腹侧视觉皮层的神经活动会随联结学习发生调谐改变。
研究背景
物体不仅具有外观,也会因经验获得奖励价值。理解这种价值如何形成和提取,需要区分“看到预测奖励的图像”与“实际收到奖励”两个事件,并确定额叶、杏仁核、纹状体和视觉皮层各自的角色。猕猴单细胞研究长期强调眶额叶皮层(OFC)神经元对奖励类型、数量和概率的编码,人类 fMRI 却更常把刺激价值定位于内侧额叶皮层(MFC)。这种跨物种差异可能来自解剖命名、采样位置和任务设计,也可能反映测量手段不同。近期损毁研究还提示,更新刺激—奖励关系所必需的区域并不总在 OFC,使单一价值中心的解释更加不足。
电生理通常只能记录预先选定的少数位点,难以在同一实验中比较整个额叶和腹侧视觉系统。全脑猕猴 fMRI 则能与人类研究使用更接近的测量,并同时检查 VLPFC、MFC、OFC、杏仁核、纹状体及 IT。另一个未解问题是价值是否只存在于额叶奖励网络:IT 对复杂物体有明确视觉调谐,若图像经学习获得奖励意义,其视觉表征也可能随之改变。要证明这一点,必须比较同一批图片在学习前后的反应,避免把原有的视觉偏好误当成价值效应。
本文让猴子每周学习一套新图片的高低奖励概率,在训练前后分别扫描,并用强化学习模型逐试次估计图像价值。事件相关设计把看图、选择和奖励到手分开建模,Reference 扫描则提供学习前基线。结果显示价值信号广泛出现在 MFC、VLPFC、纹状体、脑岛和包括 IT 的腹侧视觉区,而 OFC 更突出地响应奖励到手。这一格局有助于调和跨物种争论,但价值操纵采用奖励概率而非种类或数量,OFC 阴性也不能推广为它在所有价值任务中都不参与。
研究思路
研究策略在于使猕猴主动建立新图像的刺激—奖赏关联,随后利用事件相关 fMRI 将呈现图像时的预期价值信号与实际获得奖励时的生理响应在时间上解耦分离。逻辑链条包含:首先通过选择行为验证动物建立奖赏联结(基准参考日无系统偏好,训练后稳定偏好高概率刺激);其次利用反褶积分析证明,同一组图像在学习前的 BOLD 反应并无分化,学习后出现显著差异,从而将神经活动改变归因于奖赏学习经验而非预存的视觉偏好;最后引入时间差分强化学习模型逐试次估计图像的动态价值,将其作为参数化调制变量纳入一般线性模型(GLM),在全脑范围定位价值表征位点。实验通过固定液体奖励类型与体积、仅改变奖赏概率来操纵价值,保证了在单一奖赏介质下清晰区分预测价值与奖赏获取事件。
设计包含基线对照安排:每周首日(Reference 扫描)所有图像均以 66% 均等概率给予水奖励,动物对后续将被指定为高、低概率的两组图像未表现出系统偏好;随后在扫描仪外进行 2 天行为训练,再开展测试扫描(Test 扫描)。测试扫描中出现的反应差异因此可追溯至训练经历。通过交替呈现二选一决策试次与单图被动注视试次,并在呈现与奖赏之间插入伪随机延迟,实现了看图、选择与得奖三类事件在全脑范围的独立建模。
方法
实验动物为 3 只成年雄性恒河猴(体质量 4.7–7.1 kg),头部固定并训练维持中央注视以获取水奖励。行为范式为“选择与观看任务”(Choice and View Task):选择试次中,注视中央点 250 ms 后于双侧视野(离心度约 7.5°)呈现成对图像,维持注视 250 ms 后扫视至目标图片并保持注视 750 ms;观看试次中,单张图像呈现于屏幕中央,猴需维持注视 1000 ms。奖赏脉冲为 0.3 mL 水,依据图片设定的概率(训练与测试期:高概率 75%、低概率 25%;Reference 基准日:66%)在延迟 2–4 s 后发放。刺激材料来自经 SHINE 工具箱均衡化亮度的自然物体彩色照片,每周采用全新图像(涵盖 2 个类别共 20 张图片,每日每图平均呈现 38 次)。实验流程按周循环:Reference 扫描 → 扫描仪外训练 2 天 → Test 扫描,每只猴完成 8 周循环,共计入 8 个完整 session。
数据采集于 4.7 T 垂直磁共振系统,采用单次激发 EPI 序列(TE 22 ms,TR 2.2 s,各向同性体素 1.5 mm),表面线圈覆盖 IT、杏仁核与额叶;采集 MDEFT 与 0.5 mm 高分辨率解剖相,利用 CARET 重构皮层表面。分析使用 AFNI 与 SUMA:预处理包含几何畸变校正、片层时间校正、刚体配准与 2 mm 空间平滑。分析包含两条主线:一是反褶积分析,采用 8 个均匀 B 样条基函数估计每体素血流动力学响应曲线(试次时程 15.4 s,峰值位于图像呈现后约 4.4 s);二是时间差分(TD)强化学习模型,按公式 v(k+1) = v(k) + α(R − v(k)) 递推更新价值,经 logistic 函数映射为选择概率,以极大似然估计拟合学习率,逐试次提取中心化的价值估计作为 GLM 调节参数,进行混合效应方差分析(ANOVA)。统计检验采用未校正 P<0.005 起步,FDR 校正后控制在 0.004–0.028,结合 7 体素聚类阈值(Monte Carlo 模拟族水平 P<0.001);各报告激活峰均核查了局部时间信噪比(tSNR>40)以控制磁敏感信号丢失干扰。
主要结果
- 联结学习的行为表现(图 3):在 Reference 扫描日,猴对两组图像无系统选择偏好;随着训练推进,选择高概率图像的比例持续上升;训练天数主效应显著(F(3,95) = 150.863,P < 1×10⁻¹⁵),动物间无显著个体差异。经过 2 天训练后,在 Test 扫描中的高低概率对决试次里,高概率图像的选择比例达 92.5%。
- 价值信号由训练经验诱导产生(图 4、5):右侧下颞叶皮层(包含 TEa、TEm、TEad)在 Test 扫描中对高概率图像的激活显著强于低概率图像,而在训练前的 Reference 扫描中,同一批体素虽对视觉呈现有正向激活,但两组图片之间无统计学差异(图 4A 无显著体素)。该模式同样见于 IT 两个代表位点、内侧额叶 MFC 10m/32、腹外侧额叶 VLPFC 12、前部壳核与前部脑岛:训练前均未表现出两组间分化,训练后呈现高概率图像反应升高、低概率图像反应降低。MFC 表现出特殊模式:主要表现为对低概率图像反应的显著降低,而对高概率图像的提升相对较小。训练并未改变各区域在“实际收到奖励”时相的激活强度。
- 额叶皮层的价值编码区域分布(图 6、7):图像价值信号显著定位于 MFC 10m/32(喙状沟背侧的内侧皮层壁,在观看与选择试次中均显著)、扣带沟背侧区域(可能对应 9 区及辅助运动区)以及双侧 VLPFC 12 区(外侧眶沟外侧);而在经典眶额皮层(OFC)中,仅右半球 13b 区检测到一处局限小聚类。与之相对,OFC 11/13/14 区对“实际获得奖励”呈现强烈的正向激活(图 6C–F)。选择试次与观看试次中的价值信号强度无显著统计学差异。
- 腹侧视觉通路广泛受价值调节(图 8、9):初级与中高级视觉区(V1–V4、TEO、TE 及 STS 下岸)均显示出对图像价值的参数化编码(TEO/TE 峰值 t = 7.2,V1–V4 峰值 t = 7.3);双侧前腹侧 IT 的价值效应呈离散斑块状分布;右侧颞极出现大体积激活聚类,自腹侧 TG 区向尾侧延伸至 TEa 及嗅周皮层 36 区,左侧效应范围相对较小。
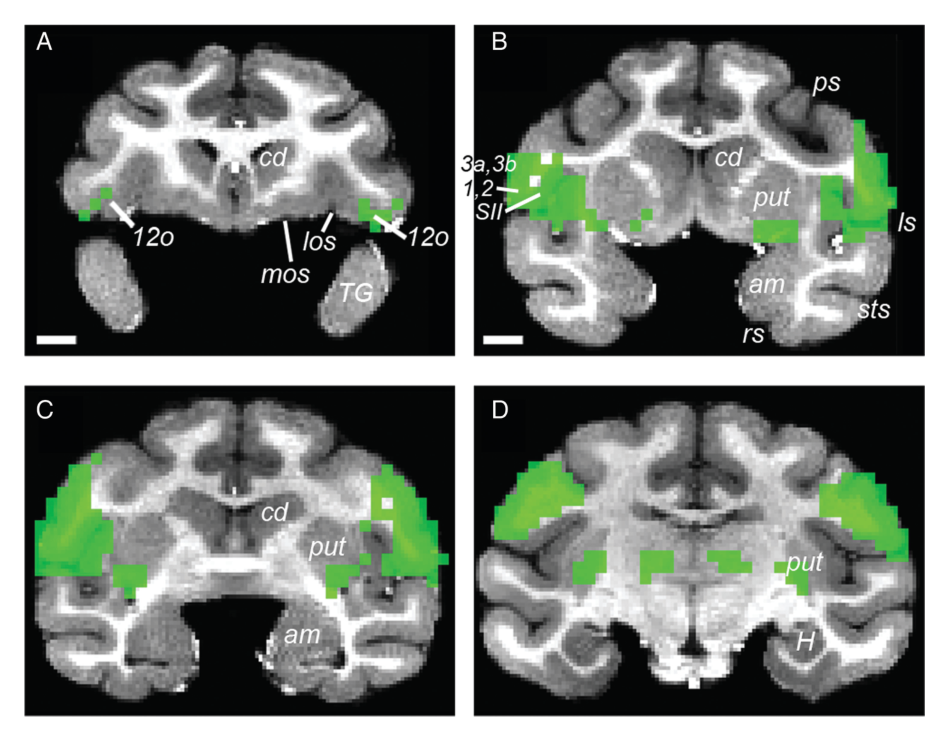
- 皮层下核团与脑岛的分离响应(图 10–13):杏仁核对图像价值及奖赏获得均未表现出显著调制,但其背外侧部表现出明确的视觉基础响应且局部 tSNR 达 50–150。纹状体中,图像价值编码主要定位于尾状核头与壳核背外侧部(壳核价值效应 t = 11.9),而奖赏获得信号则位于腹侧纹状体与腹侧壳核。前部脑岛同时对图像价值与奖赏获得表现出强反应(右侧更显著),后部颗粒区脑岛仅对图像价值响应。联合分析(conjunction)表明,同时对预期价值与实际奖赏响应的区域较为有限,主要见于 VLPFC 12o、前部及中央背侧非颗粒脑岛以及腹后部壳核的部分体素。
图注解读
图 1 · 任务流程示意
原文图注:Figure 1. Choice and View Task. The Choice and View Task consisted of 2 interleaved types of trials, choice trials and view trials, presented in random sequence. Monkeys initiated all trials by fixating on a spot in the center of the screen for 250 ms within a 3° window. After this fixation period elapsed, a single, centrally placed image appeared (view trial) or a pair of images appeared (choice trial). Choice trials always involved a choice between 2 images. The offered image pairs could take 3 forms: 2 high probability images, a high and low probability image, or 2 low probability images.
读法:本图展示了试次时序结构:包含注视建立、单图(view)或双图(choice)呈现、扫视选择以及按设定概率延迟给予水奖励。三种成对组合(高高、高低、低低)保证了选择行为可由强化学习模型进行价值估计拟合,构成了 fMRI 事件相关建模的行为基础。
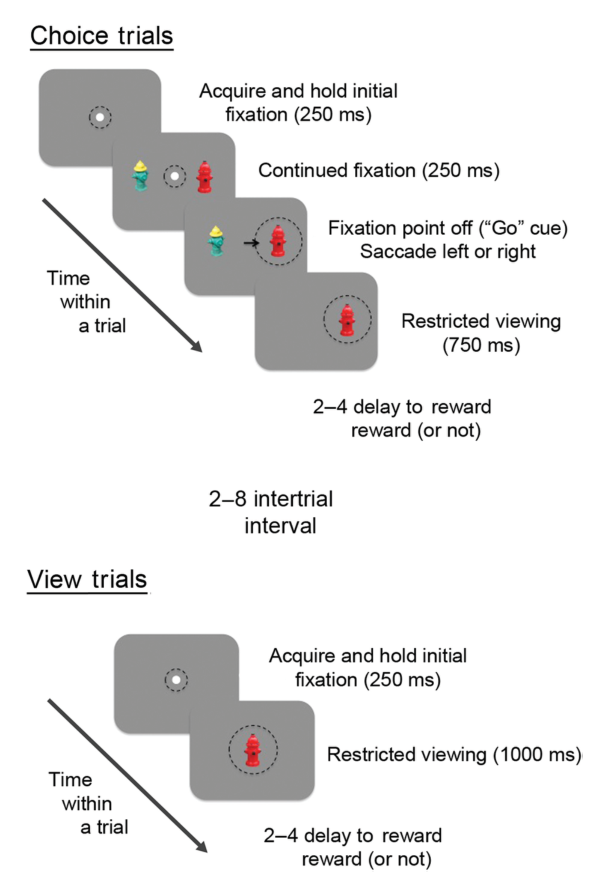
图 2 · 每周训练与扫描时间表
原文图注:Figure 2. Training and scanning schedule. Monkeys performed the Choice and View Task 4 days per week according to a fixed schedule for training and fMRI scans. Each weekly schedule consisted of 4 consecutive days with a given stimulus set: Reference scan, 2 consecutive days of training outside the scanner (Training Days 1 and 2), and a Test scan. This was repeated with novel images every week.
读法:展示了每周 4 天的固定实验进程:第 1 天 Reference 扫描(均等 66% 奖赏),第 2、3 天扫描仪外训练(建立 75% 与 25% 的高低概率分化),第 4 天 Test 扫描。该前后对照流程确保了测试阶段检测到的反应差异能够追溯至中途的条件化训练,支持主要结果第 2 条。
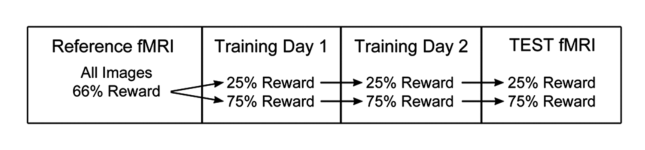
图 3 · 选择偏好随训练日上升
原文图注:Figure 3. Choice preferences. Plot shows image preferences for choice trials involving high versus low probability images for each day of the 4-day schedules. Preference for the high probability images increased over days, indicating that each of the monkeys learned the associations between images and the probability of reward. There was a significant effect of day (P < 1 × 10⁻¹⁵), but no effect of monkey (P = 0.147), nor an interaction effect (P = 0.957). Error bars are ±1 standard error of the mean (SEM) across sessions (8 sessions for each of the 3 monkeys).
读法:横轴为 4 天周期,纵轴为二选一试次中选择高概率图像的比例。Reference 日处于 50% 随机水平,经训练后逐日攀升,Test 日达到 92.5%,统计显示天数主效应显著而动物间无显著差异,为主要结果第 1 条提供了行为验证。
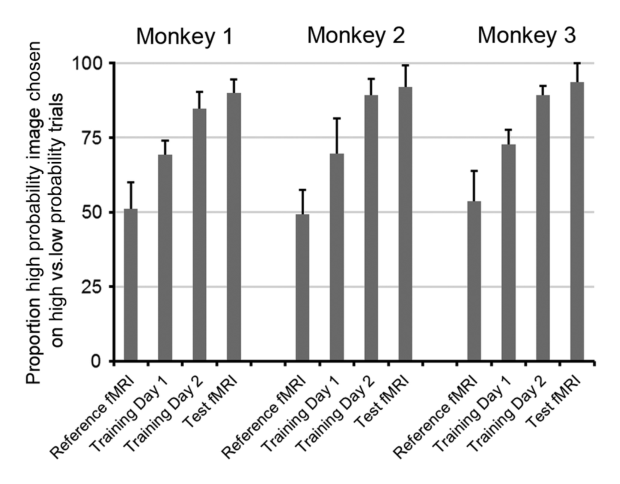
图 4 · IT 的训练前/后对比
原文图注:Figure 4. Training effects and BOLD responses in IT. (A,B) A cluster of voxels indicated by white outline (A) and corresponding BOLD time course from 3 monkeys (B) from view trials in Reference scan sessions; this significant cluster of voxels was first identified in Test scans (C). Before training, BOLD responses for high and low probability images do not differ from one another (A,B). Note, however, that IT does respond to reward-predictive visual images (B). (C) Voxels in IT (black outline) showing significant image value effects on view trials in the Test scan. (D) BOLD response time courses for images that predicted either high or low probability of reward for the voxels outlined in C.
读法:A 与 B 对应训练前的 Reference 扫描,C 与 D 对应训练后的 Test 扫描。B 中显示 IT 基础视觉响应显著,但两组图像的时间曲线重合;D 中显示训练后曲线明显分离,高概率刺激反应升高、低概率刺激反应降低,证实 IT 的价值差异是联结学习的产物。对应主要结果第 2 条。
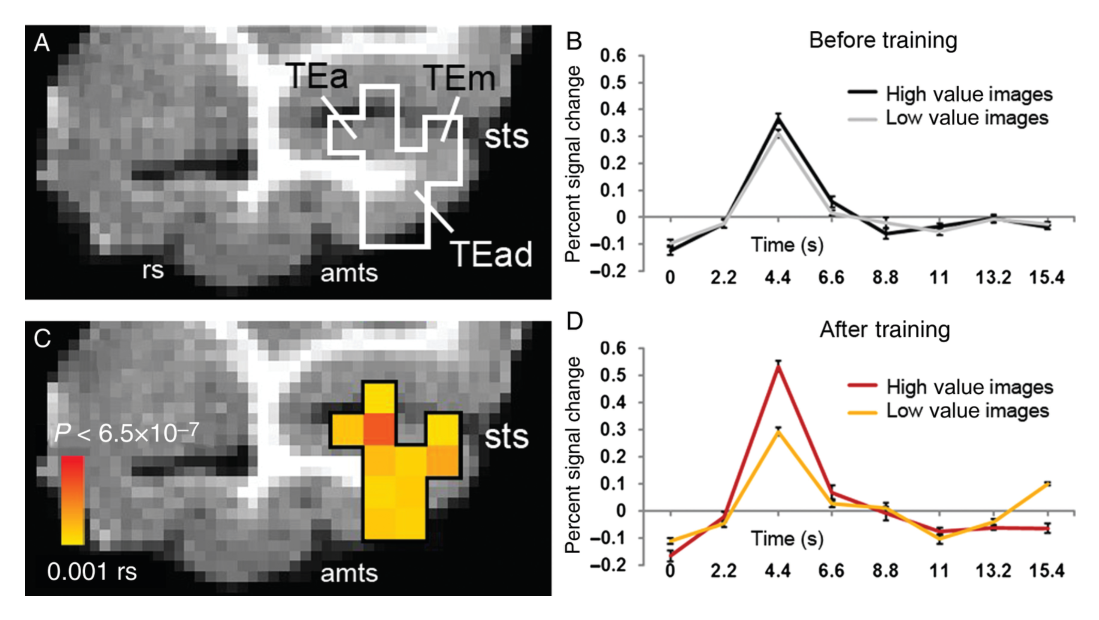
图 6 · MFC 编码价值、OFC 编码奖励到手
原文图注:Figure 6. Image value and reward receipt in MFC and OFC. A reinforcement learning model was used to estimate the values of images on each trial, which were used as a regressor in a general linear model of the data. (A,B) Significant effects of image value from view trials are shown in the mid-sagittal plane (A) and coronal plane (B), notably in a cluster of voxels on the medial wall (circle) in MFC area 10 m/32. t-Maps range from 3.125 (P = 0.005) to 7.0 (P < 6.5 × 10⁻⁷) and above; corrected FDR = 0.008. (C,D) Significant effects of reward receipt in OFC areas 11/13 and 14, shown in the mid-sagittal (C) and coronal (D) planes. Note the distinction in the regions representing image value (circle) and reward receipt (arrow).
读法:上排(A、B)显示价值参数显著聚类定位于 MFC 10m/32;下排(C、D)显示实际奖赏获得聚类定位于 OFC 14 及 11/13 区。两类信号在额叶内壁与眶面呈现解剖学双重分离,证实 MFC 编码刺激预期价值而 OFC 主要响应初级奖赏,支持主要结果第 3 条。
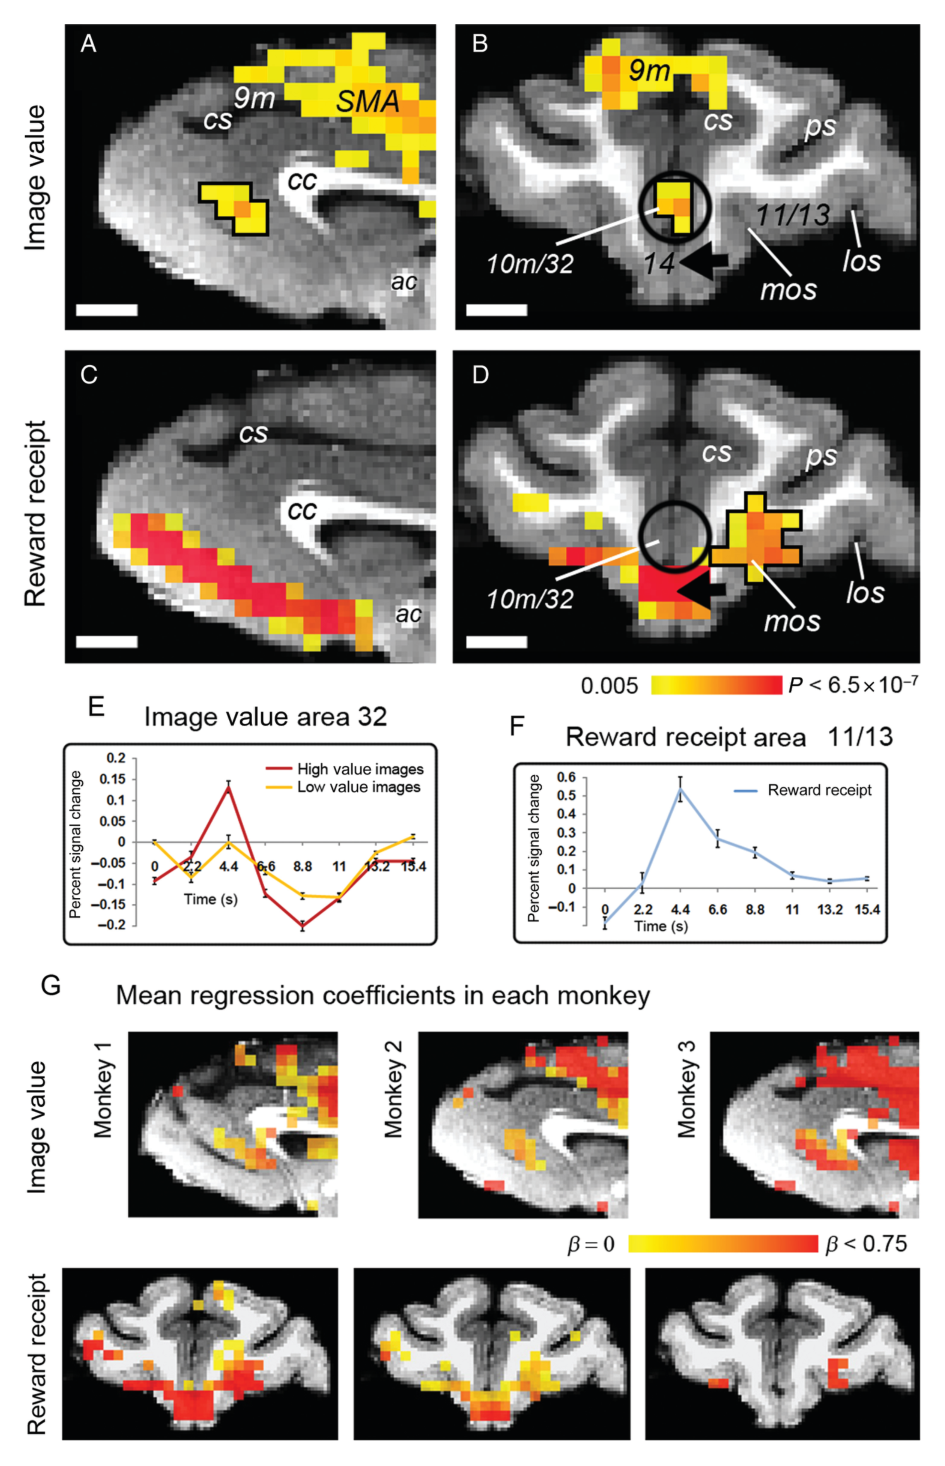
图 5 · 六个脑区的训练效应条图
原文图注:Figure 5. Image-related training effects. Percent BOLD signal change on view trials before training (Reference scans; black bars, images to be paired with high probability of reward; gray bars, images to be paired with a low probability of reward) and after training (Test scans; red bars, high probability images; yellow bars, low probability images) is shown for 6 areas in which significant voxel clusters were identified following training (P = 0.001, FDR = 0.01).
读法:展示 IT 两个位点、MFC 10m/32、VLPFC 12、前壳核与前脑岛在图像呈现后 4.4 s 峰值处的信号改变。训练前(黑/灰柱)均无显著差异,训练后(红/黄柱)发生分化。MFC 显示出以降低低价值响应为主的特异性模式。对应主要结果第 2 条。
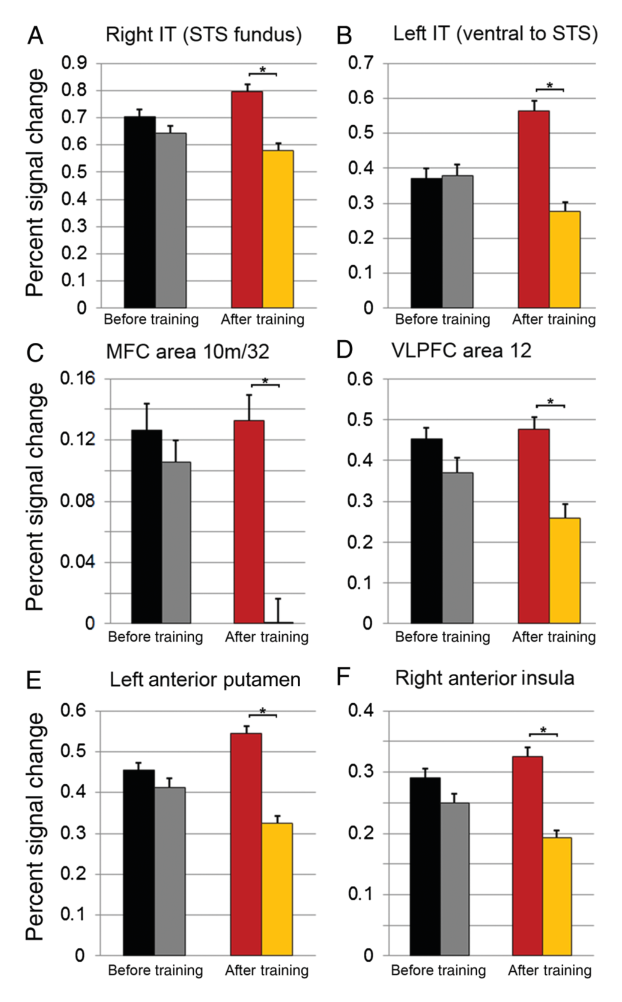
图 7 · VLPFC 12 区的价值效应
原文图注:Figure 7. Image value effects in VLPFC area 12. (A–C) Significant effects of image value in VLPFC area 12 in the left and right hemispheres from view trials shown in the coronal plane (A), a sagittal plane through the right hemisphere (B), and on a reconstruction of the frontal and anterior temporal lobe cortical surface in the right hemisphere (C). The black arrows in panels A, B, and C show the same voxel cluster in each view of the right hemisphere. (D) Bold time courses for high and low value images from VLPFC cluster surrounded by black outline in A. Other sites of activation include area 13b, insula, and TG. t-Maps range from 2.8 to 5 (P = 0.01, FDR-corrected 0.01).
读法:通过冠状、矢状和皮层重构视角指示双侧外侧眶沟外侧的 12 区,时间曲线显示高价值刺激反应高于低价值刺激。同时标注了右侧 13b 的局限激活。该区域局部 tSNR 良好,支持主要结果第 3 条。
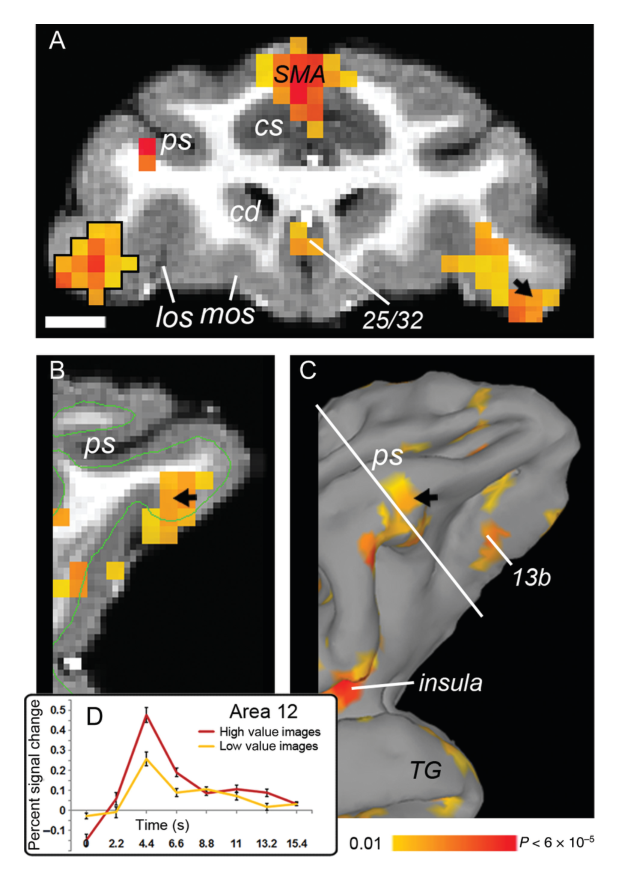
图 8 · IT 的价值编码位点
原文图注:Figure 8. Image value effects in inferior temporal cortex. (A,B) Significant effects of image value from view trials were found below and within the superior temporal sulcus (STS) in IT cortex, shown in the coronal plane for both the left (A) and right (B) hemispheres. (C,D) Sagittal sections showing the same regions responsive to image value as in A,B. (E,F) Reconstruction of the lateral surface of the left (E) and right (F) temporal lobe. The arrows in panels A, C, and E indicate the same significant voxel (t = 5.8) in TEad in the left hemisphere. Arrows in D and F indicate the same significant voxel (t = 5.2), also in TEad, in the right hemisphere. t-Maps range from 3.8 (P = 0.001) to 7.0 (P < 6.5 × 10⁻⁷) and above. Corrected at FDR = 0.028. (G,H) Plot of BOLD responses to high and low value images in the clusters indicated.
读法:多切面展示双侧 TEad、TEa 及 TEm 内的价值效应,峰值 t 达 5.2–5.8。各激活呈斑块状分布,G 与 H 展示了对应区域高低价值条件的 BOLD 响应曲线,支持主要结果第 4 条。
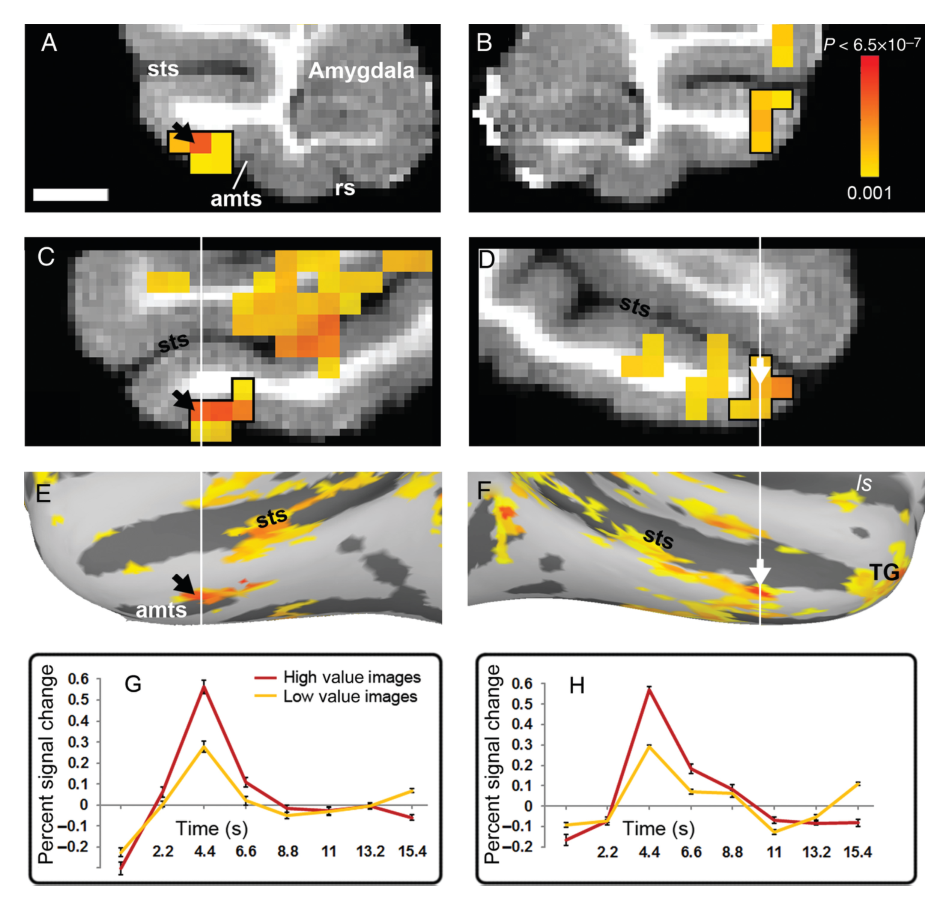
图 9 · 颞极的价值表征
原文图注:Figure 9. Image value represented in temporal polar cortex. (A) A sagittal section showing the location of area TG, surrounded by a white box. Significant effects of image value from view trials were found within the anterior temporal pole, in ventral area TG (B,C), continuing caudally to TEa/36 (E,G). White lines in B, D, and F indicate the coronal planes shown in C, E, and G; black lines in C, E, and G indicate the sagittal planes shown in B, D, and F. t-Maps range from 3.8 (P = 0.001) to 7.0 (P < 6.5 × 10⁻⁷) and above. Corrected at FDR = 0.028.
读法:结合前后切面呈现价值效应自腹侧颞极 TG 区向尾侧连续延伸至嗅周皮层 36 区的解剖跨度,显示联结学习塑造的价值表征已深入至内侧颞叶记忆系统的皮层入口。支持主要结果第 4 条。
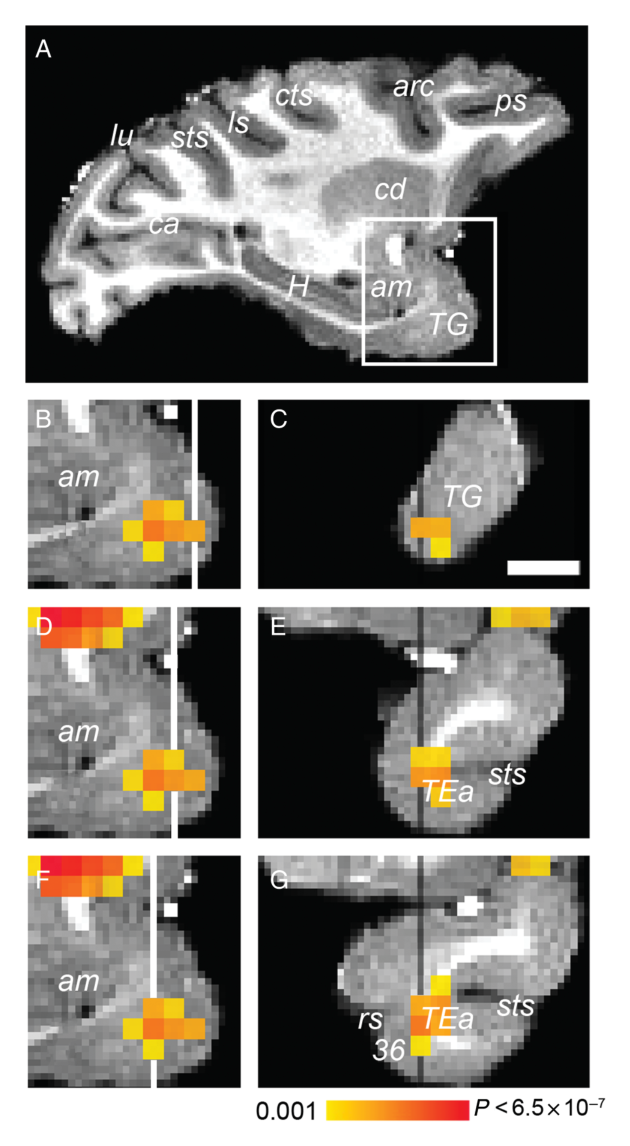
图 10 · 杏仁核的阴性结果
原文图注:Figure 10. Image value and visual responses in the amygdala. An anatomical mask was applied (not shown) to analyze data only in the amygdala; no significant effects of image value are present in the amygdala (Panel A). Visual responses are evident in the dorsal and lateral portions of the amygdala (t-statistic, P = 0.005, FDR corrected 0.008). Scale bar is 5 mm.
读法:A 图显示杏仁核解剖掩膜内无显著价值体素,B 图证实其背外侧部存在清晰的基础视觉诱发反应。该组对比排除了由于信号丢失导致阴性结果的技术假象,支持主要结果第 5 条。
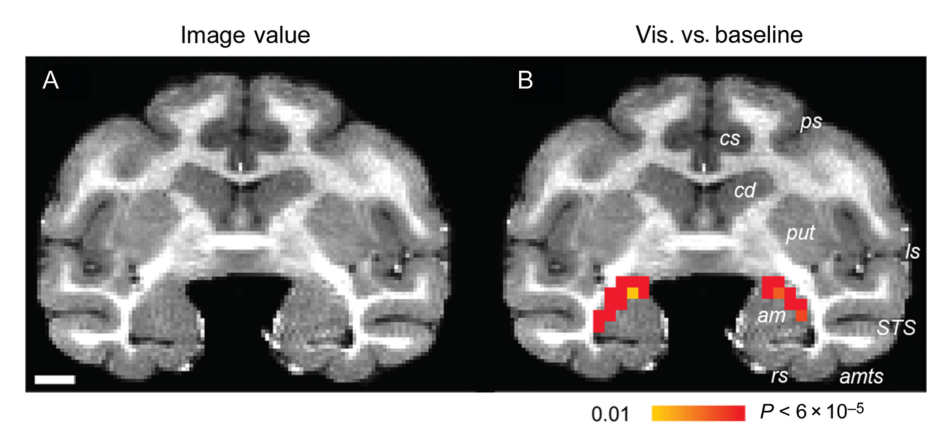
图 11 · 纹状体中价值与奖励到手的背腹分离
原文图注:Figure 11. Image value and reward receipt in the striatum. (A,B) Significant image value effects from view trials are shown at 2 anterior–posterior levels in the coronal plane. t-Maps range from 3.125 (P = 0.005) to 7.0 (P < 6.5 × 10⁻⁷) and above; corrected at FDR = 0.008. (C,D) Significant reward receipt effects are shown at equivalent anterior–posterior levels as in A,B. t-Maps range from 3.125 (P = 0.005) to 7.0 (P < 6.5 × 10⁻⁷) and above; corrected at FDR = 0.004. Dorsal striatum, including caudate head and putamen, encode value, but are not responsive to reward receipt. The ventral striatum, ventral putamen, and insula are responsive to reward receipt.
读法:冠状切面显示价值参数显著定位于背侧的尾状核头与壳核(A、B),而奖赏获得显著定位于腹侧纹状体与腹侧壳核(C、D),呈现出与既往电生理一致的背腹功能分离。对应主要结果第 5 条。
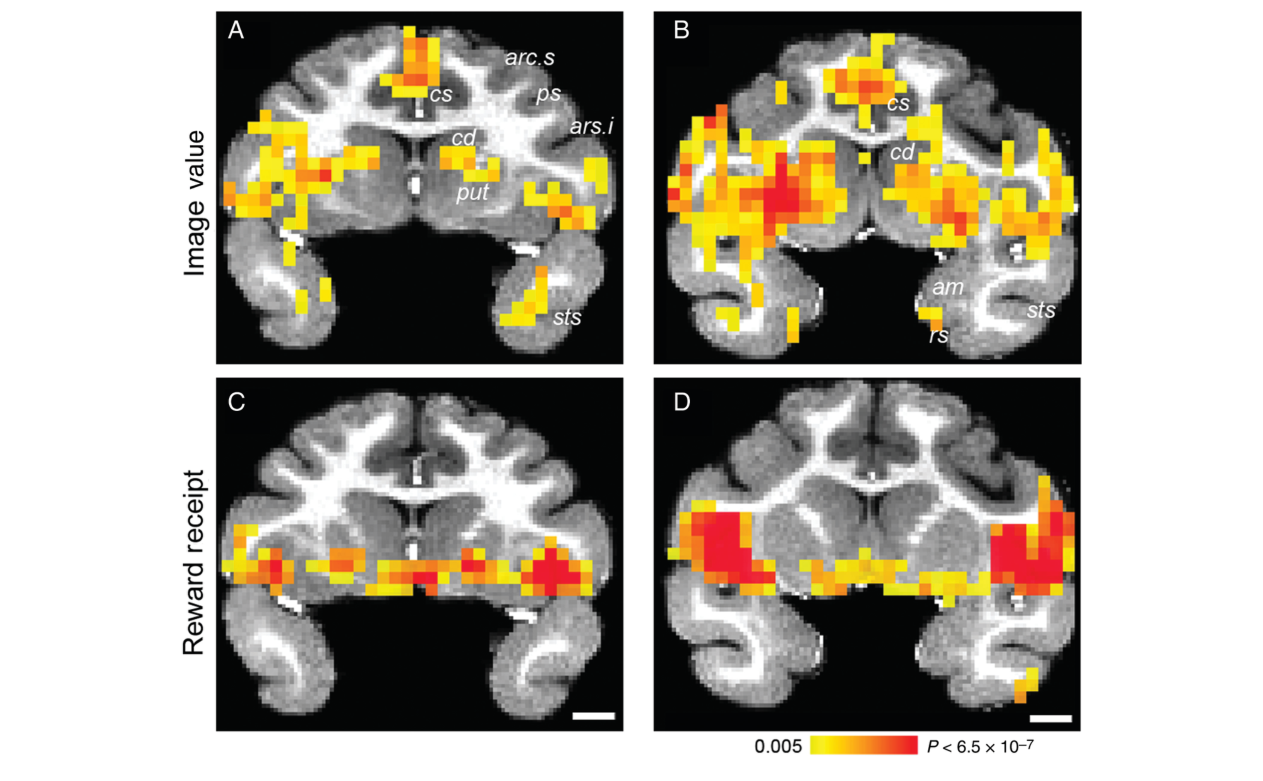
图 12 · 脑岛既编码价值也响应奖励
原文图注:Figure 12. Image value and reward receipt effects in the insula. (A,B) Sagittal (A) and coronal (B) sections showing image value effects from view trials with the anterior insula circled in black. t-Maps range from 3.8 (P = 0.001) to 7.0 (P < 6.5 × 10⁻⁷) and above; corrected at FDR = 0.012. (C,D) The same region of the insula responsive to image value (A,B) is responsive to reward receipt. The arrows in panels A and C indicate a portion of the posterior insula encoding only image value and not reward receipt. (E) Time courses of BOLD responses to high and low value images in the anterior insula (denoted by black circle) and to reward receipt in same region.
读法:前部脑岛黑圈区域同时呈现价值编码与奖赏获得响应,箭头指示的后部颗粒区脑岛仅对图像价值响应,E 图展示了对应区域两类事件的时程曲线,证实脑岛内部存在亚区功能分化。支持主要结果第 5 条。
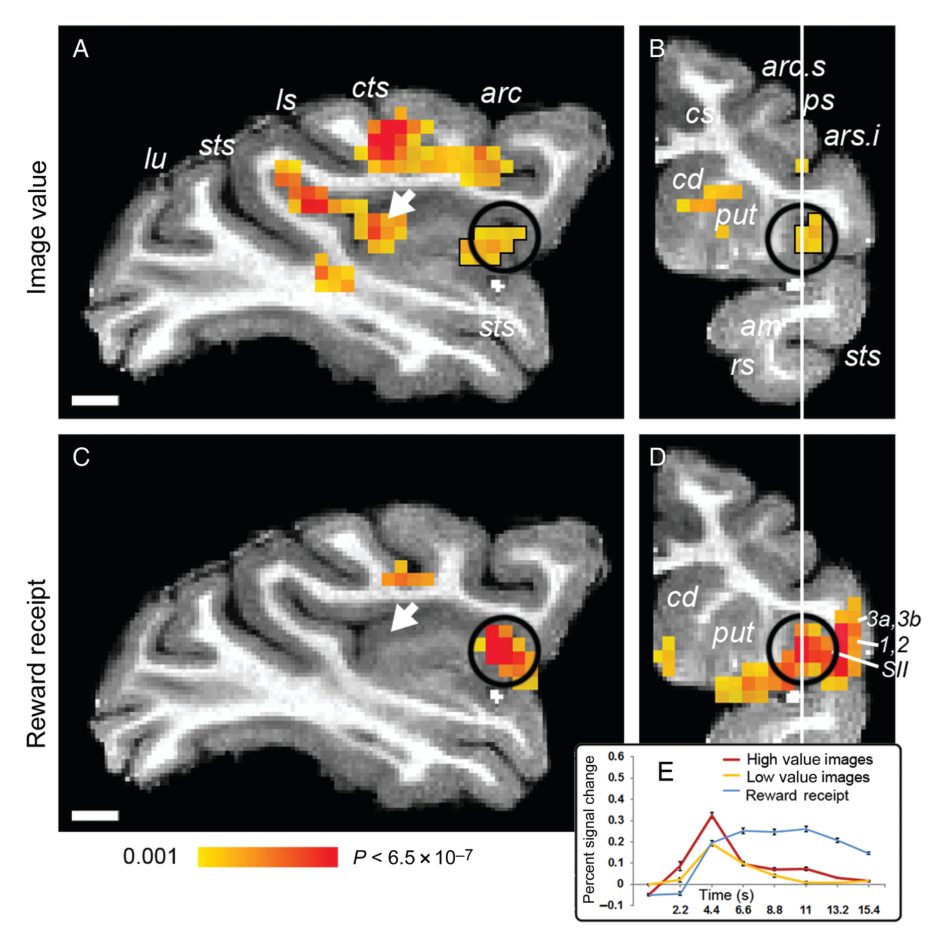
图 13 · 联合分析:兼编码价值与奖励的区域
原文图注:Figure 13. Areas encoding both image value and reward receipt. A conjunction analysis revealed a limited number of areas that encode both image value (from view trials) and reward receipt (conjunction of t-Maps at P = 0.01 in each map).
读法:在两项统计图交集下,重叠区域局限于 VLPFC 12o、前部及中央背侧非颗粒脑岛和腹后壳核局部,表明预期价值与实际奖赏信号在大部分皮层与皮层下结构中保持独立表征。支持主要结果第 5 条。
讨论
作者结合实验结果对两处关键现象展开理论讨论。关于 OFC 几乎未表现出图像价值信号:首先,本实验通过奖励概率控制价值,所有刺激所预测的生理奖赏均为固定体积(0.3 mL)的水,而文献中报告 OFC 神经元活动的实验多采用不同口味或不同体积的液体奖赏;OFC 的核心功能可能在于表征奖赏的具体感官属性(如风味与量级)并将其与预测线索相联系,因此在奖赏物理属性恒定且仅概率变化的范式下未被充分激活。其次,本研究测查的是训练完成后的稳定价值提取阶段,OFC 可能优先参与初始联结的快速形成而非长时表征的维持。与之相对,MFC 10m/32 的强价值信号与人类神经影像元分析高度一致,支持其作为哺乳动物额叶内侧前边缘皮层(prelimbic cortex)同源结构的假说,并提示应将其与更后背侧的扣带运动皮层严格区分。VLPFC 12 区的价值激活则与近期单细胞记录中该区具备最高比例价值编码细胞的发现契合,为损毁研究中客体反转学习障碍提供了功能定位支持。
关于视觉皮层的神经可塑性,IT 皮层对习得价值的编码可能源于联结学习期由皮层下中继触发的可塑性重塑;额叶眼区(FEF)与顶下小叶(LIP)在当前任务中均未检测到价值调节,提示视觉区的激活并非源于自上而下的空间注意分配,但注意与奖赏的潜在交织仍无法完全排除。IT 价值效应的斑块状分布提示其可能与固有的物体特征柱结构存在解剖对应。在奖赏获得层面,OFC 11/13/14 区对饮水事件的稳健激活排除了该区域存在技术性扫描失真的解释;脑岛及前盖部的得奖响应可能与吞咽及体感反馈相关。研究的局限包括 fMRI 信号缺乏单细胞水平的时空分辨率,无法确立所发现环路的因果必要性,这需要结合后续微刺激或光遗传学干预进行裁决。
一句话总结
本研究在功能解剖层面解耦了物体联结学习中的两个核心过程:预测性线索的习得价值表征定位于内侧额叶(MFC)、腹外侧额叶(VLPFC)及腹侧视觉通路(含 IT),而初级奖赏获得的生理响应主要定位于眶额皮层(OFC)、腹侧纹状体与脑岛。在控制物理奖赏恒定的设计下,OFC 在预期阶段表现出非显著性,而下颞叶与早期视皮层展现出由经验塑造的价值调谐,为理解感知系统受强化历史动态重塑提供了全脑证据。