这篇文章用清醒猴单细胞记录直击视觉工作记忆(visual working memory, VWM)领域的老争论:下颞皮层(inferior temporal cortex, ITC)到底只是物体的"编码器",还是也参与记忆保持与匹配比较?作者让两只猴执行四种"同/不同"判断任务(含遮挡与干扰物版本),记录高选择性的 ITC 神经元,结果显示约半数细胞在延迟期保持刺激选择性、群体解码足以复现行为水平、且"匹配增强"先于局部场电位出现——为"ITC 中存在被主动重激活的记忆痕迹"提供了当时相当完整的证据链。
研究背景
VWM 指在刺激已从视网膜上消失后,暂时表征、操纵并监控视觉信息的能力(Baddeley, 1996),其神经基础长期聚讼于前额叶皮层(prefrontal cortex, PFC)与后部视觉区(含 ITC)的分工。1990 年代的主流证据是:ITC 的选择性延迟期活动易被 intervening 干扰信息冲掉(Miller et al., 1993),而 PFC 神经元对干扰有抵抗力(Miller et al., 1996),由此形成"内容存储在后部感觉皮层、靠 PFC 自上而下的维持信号才得以延续"的框架(Ranganath and D'Esposito, 2005)。在这一框架下,物体工作记忆应当预言 ITC 内有暂时表征已不可见的复杂物体信息的活动——事实上早期证据并不缺席:损毁研究提示 ITC 参与视觉信息保持(Mishkin, 1982),延迟反应任务中 ITC 神经元呈现视觉选择性的延迟期活动(Fuster and Jervey, 1982; Miyashita and Chang, 1988);而且晚近 Meyers 等(2008)发现 ITC 神经群体在延迟期后段会重新获得类别选择性,说明 ITC 的参与超出编码、延伸入记忆时段。ITC 还参与 VWM 的匹配环节:有的 ITC 神经元对"与心中所持样本匹配"的刺激反应更强(匹配增强,match enhancement),对单纯重复出现的刺激反应更弱(匹配抑制,match suppression)(Baylis and Rolls, 1987; Miller and Desimone, 1994 等);匹配增强一直被假定为 PFC 反馈对 ITC 视觉活动的偏置所致,但其皮层起源与回路并不清楚。缺口在于:ITC 延迟期活动易受干扰、且以往的"物体永久性"式任务设计(刺激消失方式各异)与真实遮挡场景相去甚远——作者正是在更物理真实的遮挡范式下、聚焦高选择性单细胞来重新检验 ITC 在 VWM 中的角色。
研究思路
作者的策略有三条腿。第一,只记录"高选择性"神经元:以往研究提示选择性高的 ITC 神经元可能优先参与 VWM(Mikami, 1995),因此他们在线上筛选时只保留对任选的有效/无效刺激对有可靠差分反应的细胞,用一套严格标准(刺激选择性指数、ROC 曲线下面积、记录稳定性)把样本收窄到最可分辨的那批,以便在单个细胞层面看清记忆动态。第二,任务设计从"消失"走向"遮挡":四种条件里,除了样本消失后延迟期为空白的标准情形,还加入了背景色隐形方块逐渐盖住样本、可见黑方块遮挡(延迟期方块始终在场,暗示物体仍在)、以及黑方块内嵌复杂图像(既有物体在场暗示又引入干扰信息)三种版本——由此既能检验"刺激消失方式"对神经活动的影响(物体永久性),又能考察干扰信息存在时延迟期选择性与记忆痕迹的存续。第三,单细胞与群体、电位与场电位互证:单细胞 ROC 之外用线性支持向量机(support vector machine, SVM)解码 64 个细胞联合活动的信息量,用韦布尔函数拟合"多少个细胞才能达到行为水平";再把单细胞差分与局部场电位(local field potential, LFP)差分的时间先后做对照——若尖信号先于场电位出现,则匹配效应的加工很可能发生在 ITC 局部而非自上游"灌入"。这四条证据链(编码—延迟—匹配—场电位)在文中依次展开。
方法
被试为两只成年雄性恒河猴(M 与 R,9.0–11.0 kg),植入钛质头柱,在左半球(M)或右半球(R)Horsley-Clark 坐标约 +15 前、+20 侧处开颅置记录室;钨丝微电极(1.0–1.5 或 7.0 MΩ)经导引管推进,信号分为低频(0.3–300 Hz,LFP)与高频(100 Hz–6 kHz,spike)两路,以 2.5/34 kHz 采样;分选线上用阈值与双幅度窗、线下用聚类软件(Quiroga et al., 2004);猴 R 的记录位置经 MRI 确证。眼位由 EyeLinkII(500 Hz)监控,全部试次要求眼位保持在 2.5°×2.5° 框内。刺激集为 125 张日常物品彩色图片(每张约 2.0°×2.0°,Hemera 图库),每次记录只用其中 7 张:2 张按该细胞反应特性选定(有效/无效刺激),5 张随机(其中 1 张兼任复杂遮挡物)。记录前后各做一个 viewing-only 任务(每图 200 毫秒呈现、200 毫秒间隔、重复 10 次)用于刻画选择性。行为任务为"同/不同"判断的四种条件:消失(disappear,样本呈现 1 秒、空白延迟 1 秒、再呈现选择刺激)、隐形遮挡(invisible occluder,背景色方块以 4°/s 从上方渐近遮挡样本,延迟期开始时完全遮住)、黑方块遮挡(square occluder,黑方块全程可见,延迟结束瞬间被选择刺激替换)与复杂遮挡(complex occluder,黑方块内嵌复杂图像)。每块 96 试次、四条件均分,每条件 6 次有效、6 次无效刺激试次;同/不同试次各半。共 69 个记录 session(M 34、R 35),记录 134 个细胞,其中 79 个通过筛选进入分析:仅保留 viewing-only 中刺激选择性指数 SSI ≥ 0.25(均值 0.70)、ROC 曲线下面积 AUC ≥ 0.75(均值 0.98)、且记录首尾对 7 张图的反应模式稳定(Pearson r ≥ 0.75,均值 0.94)的细胞。两猴行为良好:三个较简单条件约 90%,复杂遮挡条件约 80% 且波动最大;黑方块与复杂遮挡条件下反应时显著更长(F(3,272)=180.58,p<0.0001)。分析中尖峰序列以 σ=10 毫秒的高斯核卷积为尖峰密度函数(spike density function, SDF);匹配效应分析要求每细胞至少 5 次匹配与 5 次非匹配试次(有效刺激下余 73/77/73/69 个细胞);差异是否及何时显著用 Blair-Karniski 置换检验(10,000 次置换、双侧 α=0.05)。群体 SVM 用 R 的 e1071 包、仅线性核(避免非线性变换以保持生物学合理性),每时间点随机抽 64 个细胞、各抽 12 次有效与 12 次无效试次,训练 16 试次、测试 8 试次、交叉验证 3 次、整体重抽样 100 次得均值与标准差;延迟期整体分析(最后 750 毫秒)另以 1–64 个细胞规模拟合比例正确 = 1 − 0.5·e^(−(n/τ)^β) 的韦布尔函数(τ 为达到 82% 正确所需细胞数,β 为斜率)。
主要结果
- 编码期选择性强,且约半数高选择性细胞在延迟期保持刺激选择性。 单细胞层面,两例示例神经元在四条件的编码期 AUC 都逼近 1.0,延迟期行为却分化:一例在包括复杂遮挡在内的所有条件中持续保持选择性,另一例在消失与隐形遮挡条件下延迟后段回升、在方块与复杂遮挡条件下全程处于猜测水平(图 3)。全群体统计(以延迟期最后 750 毫秒计):消失、隐形遮挡、方块遮挡的群体平均 AUC 分别为 0.65、0.64、0.59(均 p<0.0001),复杂遮挡条件为 0.52(p=0.24);显著延迟选择性的细胞比例在消失与隐形遮挡条件下达 41.8%(33/79)与 45.6%(36/79),复杂遮挡条件下仍有 12.7%(10/79,二项检验 p=0.006)高于 chance(图 4)。把延迟期后 750 毫秒切为三段后段比较,三个简单条件的 AUC 显著上升(ΔAUC 依次 0.05、0.06、0.08,p≤0.0003;复杂遮挡 0.00,p=0.94)——选择性不是编码活动的被动"漏出",而是随决策临近被重新提起(reinstated)。
- 群体解码大幅超越单细胞,约 100 个细胞即可复现猴的行为水平。 滑窗 SVM(64 细胞)在编码期四个条件下都近乎完美解码,且在消失与隐形遮挡条件下延迟期大部分时间保持显著信息量;分类性能在延迟期末段整体上扬(图 5A)。以延迟期整体活动解码,64 细胞的正确率在四条件分别为 0.995±0.013、0.994±0.016、0.914±0.065、0.803±0.088;韦布尔拟合给出达到 82% 正确所需细胞数 τ 依次约 8.4、9.2、26.7、71.3(复杂遮挡条件阈值最高、斜率最浅);外推到 n=100 的正确率(1.00、1.00、0.95、0.86)与两猴的平均行为水平(0.98、0.97、0.96、0.86)高度吻合(图 5B)。
- 选择期:ITC 编码选择刺激,视觉潜伏期与选择潜伏期都和反应时强相关。 选择刺激诱发的有效/无效反应高度可分;方块与复杂遮挡条件下反应发展更慢(前向掩蔽效应),视觉潜伏期按条件依次约 117.91、118.63、134.38、149.56 毫秒(F(3,312)=32.11,p<0.0001);细胞视觉潜伏期与猴标准化反应时相关 r=0.66,而选择性潜伏期与反应时相关更强(r=0.71,均 p<0.0001)——ITC 活动与行为决策的时间进程紧密耦合(图 6)。
- 匹配效应是"先增强、后抑制"的两段式:早期匹配增强可靠出现且具刺激特异性,随后的匹配抑制平均晚于视觉选择性约 35 毫秒出现。 对有效刺激,四条件在视觉反应最初 50 毫秒的 AUC 均显著大于 0.5(p≤0.001),最后 50 毫秒均显著小于 0.5(p≤0.0014)(图 7C/D);对无效刺激重复同一分析则只见匹配抑制(图 7E)——增强只瞄准表征该刺激所需的那批细胞。匹配抑制的平均出现时刻比首个视觉选择性信号晚 35.37 毫秒(配对 t 检验 p<0.0001),提示它不太可能是纯自下而上的输入特性,而更像"加工已完成"的标记(图 7F)。
- 尖信号的匹配增强先于 LFP 的任何显著匹配效应出现——增强很可能是 ITC 局部加工的产物。 匹配/非匹配的 LFP 波形确有稳定差异(图 8A/B),但把两者差分做 t 变换比较后发现:四个条件中,最早的显著匹配效应都在单细胞反应里、且 LFP 差异滞后于 SDF 差异(图 8C–F);隐形遮挡条件下尖信号匹配增强在刺激呈现后约 20 毫秒即达显著,甚至早于视觉反应的诱发。值得注意的是,延迟期选择性与匹配增强可部分分离:复杂遮挡条件几乎没有持续的单细胞延迟选择性,却照样呈现匹配增强——这说明记忆痕迹即便在放电层面被干扰"冲淡",仍能在回忆时刻显影。
图注解读
图 1 · 任务、刺激与行为表现
原文图注:Figure 1. Task, stimuli, and behavioral performance. A, Disappear condition. A sample was presented for 1 s, followed by a 1 s blank delay period, at the end of which a choice stimulus appeared. The monkey's task was to indicate with either a right or left button press whether the choice matched the sample. B, Invisible occluder condition. Same as in A, except that, during the 1 s sample presentation time, a square of the same color as the background gradually occluded the sample, reaching full occlusion at the onset of the delay interval. C, Square occluder condition. Same as in B, but the occluder was now a black square. D, Complex occluder condition. Same as in C, but there was a complex visual stimulus embedded inside the black square. All conditions (A–D) required the monkey to first fixate a small spot in the center of the display before trial onset. E, Example stimuli. Twelve of the 125 stimuli used throughout the recording sessions. F, Performance of the two monkeys averaged across all recording sessions and sorted by condition. Error bars indicate SD of performance across the 69 sessions. Notice the slightly worse and more variable performance in the complex occluder condition. G, Cumulative distribution of the reaction times of all recording sessions sorted by condition. The more difficult conditions (square and complex occluder) led to longer reaction times (F(3,272) = 180.58; p < 0.0001). (注:原 PDF 提取文本丢失全部空格,此处已按原意复原断词,并因篇幅在后半段略有节选。)
A–D 四联示意图给出四种条件的时序:竖排是"样本 1 秒 — 延迟 1 秒 — 选择刺激",差异全在延迟期的视觉环境(空白 / 隐形方块渐遮 / 可见黑方块 / 黑方块内嵌复杂图)。E 展示 125 张日常物品刺激中的 12 张。F 是行为正确率(按条件,误差为 69 个 session 间的 SD):三个简单条件约 90%,复杂遮挡条件略低且方差大。G 是反应时累积分布:更难的两个遮挡条件反应时更长。这张图立起全文的行为底盘——任务可解、难度有梯度,为后文"复杂遮挡条件下神经选择性与行为同降"的对应关系提供参照。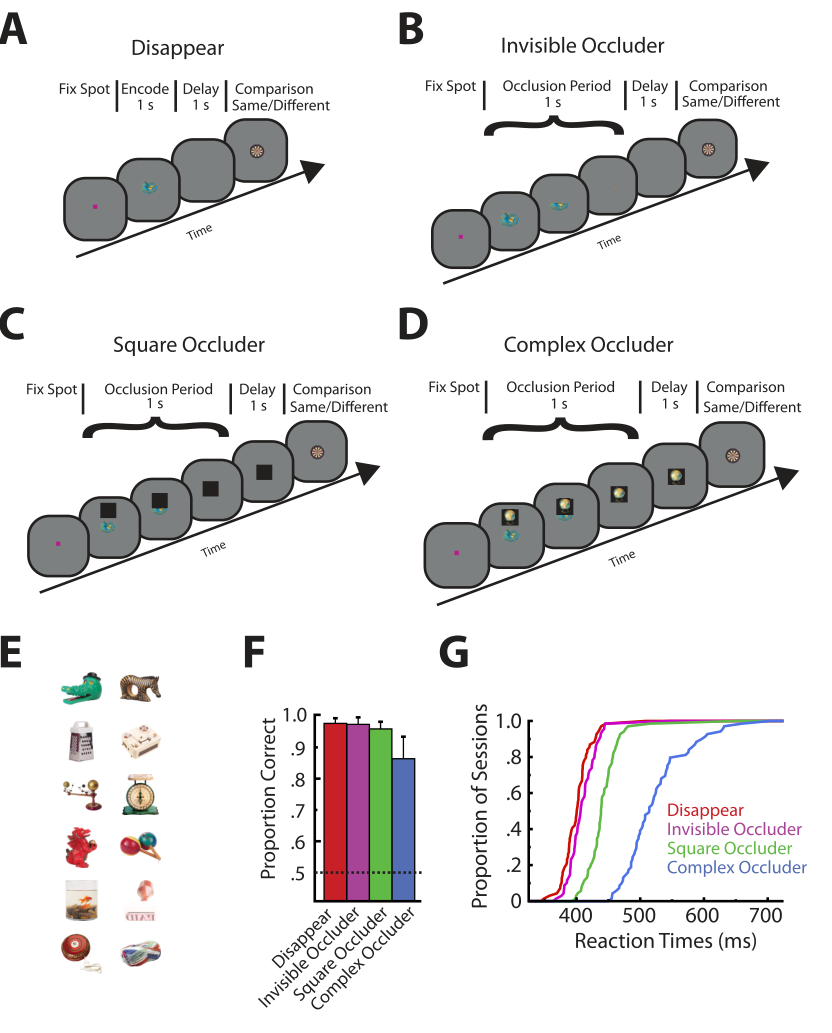
图 2 · viewing-only 任务中细胞的选择性
原文图注:Figure 2. Selectivity of cells during a viewing-only task. A, Three typical cells. Each row of plots depicts the responses (rasters and spike density functions) of one cell to the presentation of the effective, ineffective, and complex occluder stimuli as well as to four other randomly chosen objects. Notice the robust selectivity as pertains to the effective and ineffective pair. B, Population averaged spike density functions sorted by effective, ineffective, and complex occluder labels. The plot includes data only from cells that had SSIs ≥ 0.25, AUCs ≥ 0.75, and Pearson's r ≥ 0.75 (for additional details, see Materials and Methods). Note the large and extended differences between the effective and ineffective response time courses. Also, although the complex occluder was chosen randomly, it is evident that it rarely elicited a response much bigger than the ineffective stimulus.
A 面板逐行展示三个典型细胞的栅格图与 SDF:每行是该细胞对有效刺激、无效刺激、复杂遮挡物及四张随机物体的反应——有效/无效对的反应差一目了然,这就是入样标准(SSI ≥ 0.25、AUC ≥ 0.75、r ≥ 0.75)的直观来源。B 是按有效、无效、复杂遮挡标签平均的群体 SDF:有效与无效刺激的时间过程差异大且持久,而随机选出的复杂遮挡物很少引起明显强于无效刺激的反应。此图交代了全文分析的"原料质量":样本刻意偏向高可分辨细胞,支撑后文"选择性延迟活动比例高于以往报道"的解释。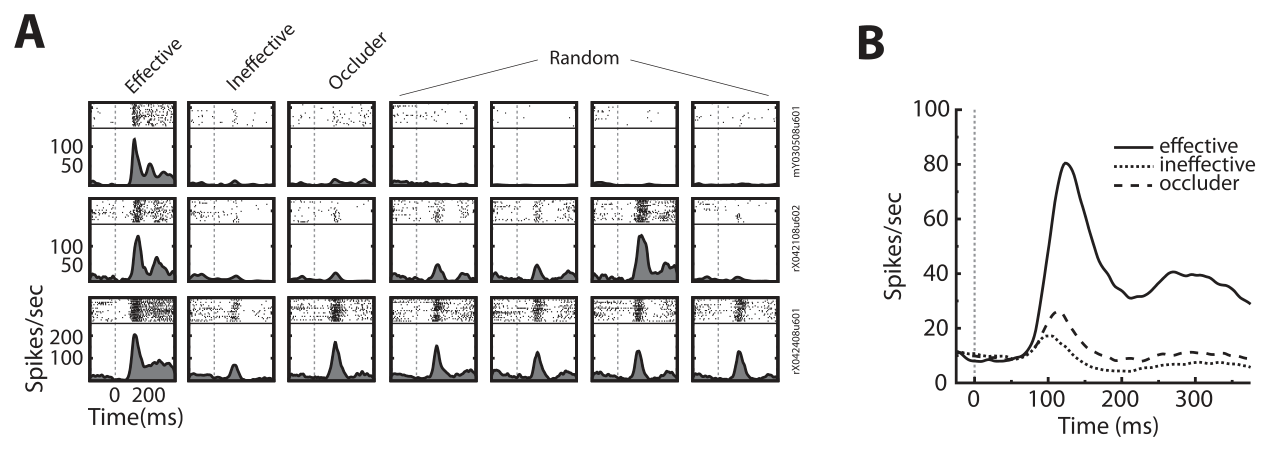
图 3 · 两个示例神经元的编码期与延迟期活动
原文图注:Figure 3. Encoding and delay period activities of two example neurons. A, B, Spike density functions of two example neurons sorted by image effectiveness and condition. Observe the robust response differences during the encoding epoch of all conditions in both A and B. The differences become much smaller during the delay period, vanishing altogether in the square and complex occluder conditions in B. C, D, Sliding window ROC analyses (step, 10 ms; window, 100 ms) for the same two neurons. Each AUC line compares the responses to the effective versus ineffective stimulus for one condition. Note that the neuron in C sustained its stimulus-selective response throughout the delay periods of all conditions. The neuron shown in D, however, exhibited no stimulus selectivity during the delay periods of the square and complex occluder conditions.
A、B 分别是两个示例神经元按有效/无效 × 四条件排布的 SDF;C、D 是同一对神经元的滑窗 ROC(每条线是一个条件下有效 vs 无效的 AUC 时间过程)。读法:先在 A/B 里确认编码期四个条件都有强分离,再到 C/D 看延迟期——C 中的神经元在所有条件(含复杂遮挡,蓝线)的延迟期 AUC 都高于 chance,D 中的神经元则在方块(绿)与复杂遮挡(蓝)条件下全程贴着 0.5、只在消失(红)与隐形遮挡(洋红)条件下延迟后段回升。这一对反差个体正是"延迟期选择性因细胞而异、因条件而异"的具象化,支撑主要结果第 1 条的前半。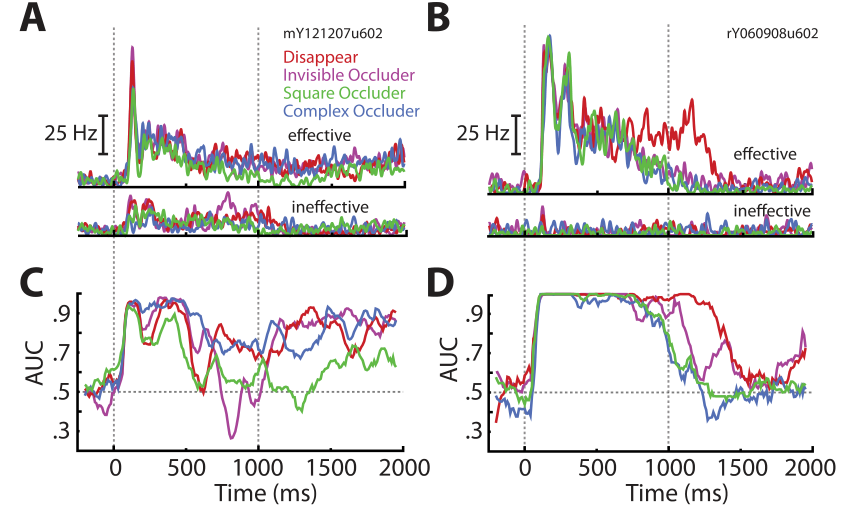
图 4 · 编码期与延迟期 AUC 的群体分析
原文图注:Figure 4. Analysis of encoding and delay period AUCs. A, AUCs of individual neurons sorted by condition. The plots show the AUCs for all neurons (ordinate) as a function of time (abscissa) and condition (panel). AUC values are color coded, with hotter colors illustrating values closer to 1.0. For every condition independently, we have sorted the neurons in descending order of delay period AUCs (as computed in C). Note, by inspecting the top parts of the panels, that every condition had a subpopulation of neurons that exhibited stimulus-selective responses during the delay. B, Population averaged AUCs. Each curve depicts the sliding window AUCs averaged across the entire population of neurons for one condition. Shaded regions indicate ±1 SEM. The two vertical dotted lines in A and B indicate sample and delay onset, respectively. C, Population histograms of delay period AUCs. The AUC values were computed from the entire last 750 ms of the delay period. The black bars indicate individual cells that were significant at the α = 0.05 level (Mann–Whitney U test). The arrows denote the population means of the distributions. Notice that the population means for the three simpler conditions were all significantly above 0.50 (p < 0.0001 in all cases). Although the complex occluder condition did not have a population mean significantly different from 0.50, 10 individual cells (of 79) did have significantly increased responses to the effective stimulus, more than expected by chance (binomial test, p < 0.006). (注:后半段已节选。)
A 是四个条件分面的"AUC 热图":纵轴为按延迟期 AUC 降序排列的全部细胞,横轴为时间,颜色越热 AUC 越接近 1——顶部那些延迟段持续发红的行就是各条件下的延迟期选择性细胞。B 是全群体平均的滑窗 AUC 曲线(阴影 ±1 SEM,两条竖虚线标样本与延迟起点):刺激消失后选择性骤降、三个简单条件在延迟后段部分回升。C 是延迟期整体(最后 750 毫秒)AUC 的分布直方图,黑柱为 Mann-Whitney 检验显著的细胞,箭头为均值——三个简单条件均值 0.59–0.65 显著高于 0.5,复杂遮挡均值 0.52 不显著但仍有 10/79 个细胞个体显著。此图是主要结果第 1 条的定量总图。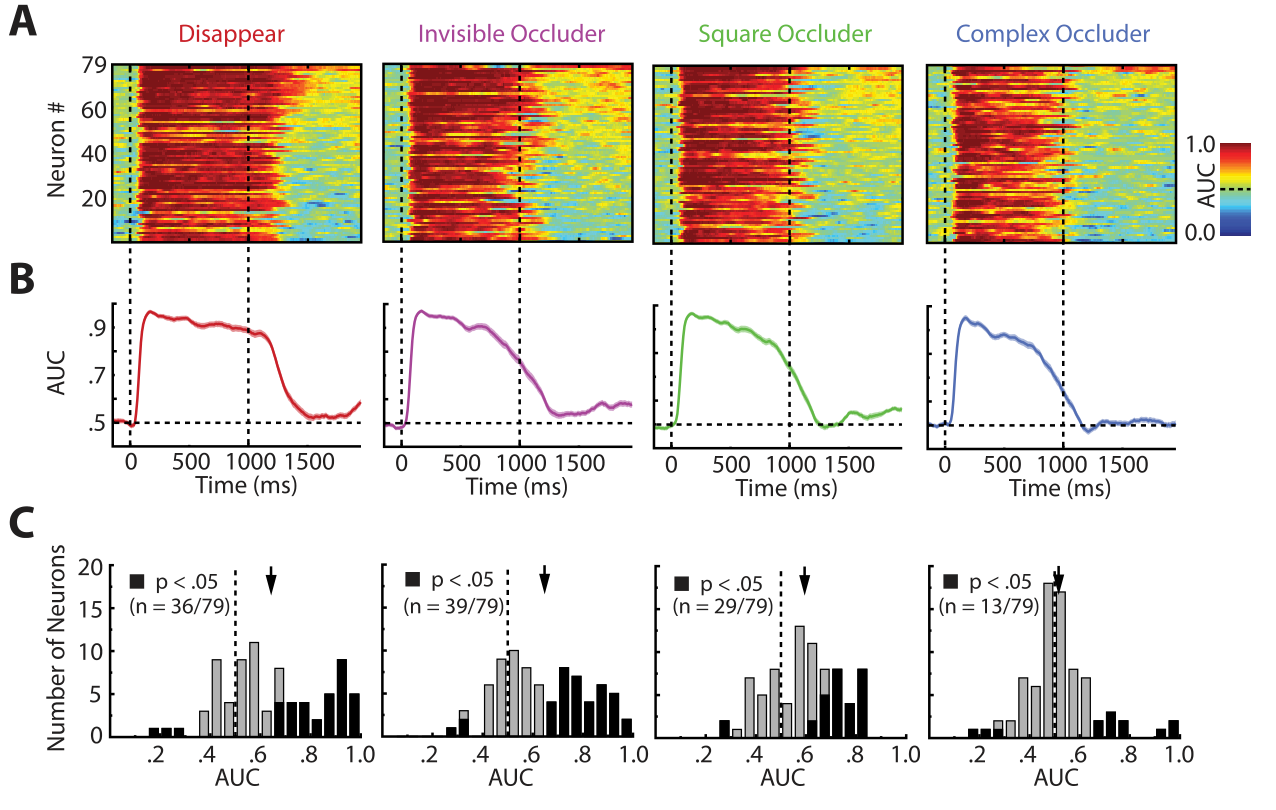
图 5 · 线性 SVM 的群体解码分析
原文图注:Figure 5. Population analyses using linear SVM. A, Sliding window SVM analyses. Each panel plots the results of the sliding window SVM analysis (step, 10 ms; window, 100 ms) for one condition. In every case, 64 randomly selected cells were used to train and test the classifier. Shaded regions indicate ±1 SD across 100 bootstrap-like iterations of the training and testing procedure. For every single time point and for every single iteration of the resampling procedure, a new set of 64 randomly selected cells was used. For comparison, we have replotted the average AUC values from Figure 4B (dotted line). Notice the consistently better performance for the population of cells compared with the single cell. Also, note the rise in classification performance as the delay epoch draws to a close. B, Performance of the linear SVM classifier for the entire delay period (1250–2000 ms) as a function of the number of cells and condition. Error bars indicate ±1 SD across 100 bootstrap-like iterations. Lines indicate best-fit Weibull functions. Note the well above chance performance for 64 cells in every single condition (rightmost points). Also, observe that the complex occluder Weibull fit had the highest threshold and shallowest slope, indicating that more cells would be needed to achieve the same level of classifier performance as in the other conditions.
A 是四个条件的滑窗 SVM 解码曲线(纵轴分类正确率,阴影 ±1 SD,虚线叠上图 4B 的单细胞平均 AUC 作对照):编码期四个条件都近满分,群体曲线始终高于单细胞对照,且延迟末段同步上扬。B 是延迟期整体解码正确率对细胞数(1–64)的函数,附韦布尔拟合:64 细胞时四条件全部远高于 chance(右端点),复杂遮挡条件的拟合阈值最高、斜率最浅。读此图要抓住两件事:其一,把信息量从单细胞拼成群体后,延迟期的"刺激身份"信息量大增(主要结果第 2 条);其二,外推 100 个细胞即可对上行为正确率——这是"ITC 群体活动足以支撑任务表现"的关键换算。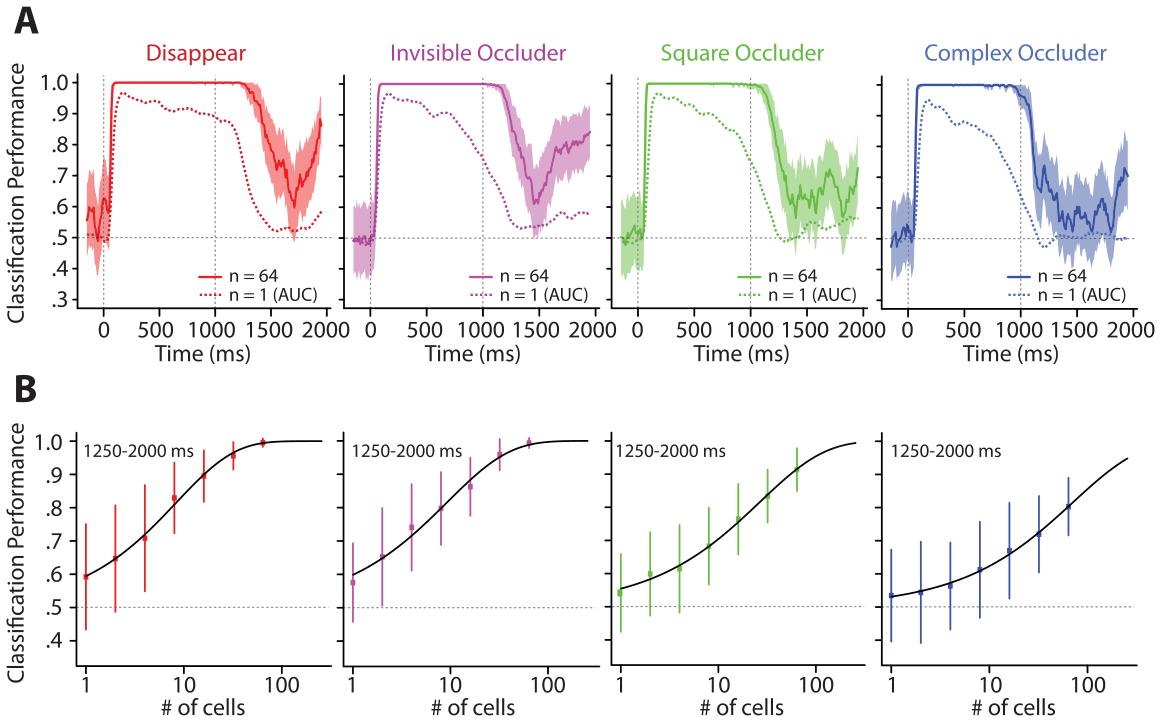
图 6 · 选择期反应分析
原文图注:Figure 6. Analysis of choice epoch responses. A, Population averaged spike density functions sorted by image effectiveness and condition. Note the temporal staggering of the responses reflecting the forward masking effect from the square and complex occluders. B, Population averaged sliding window ROC analyses sorted by condition (step, 10 ms; window, 100 ms). Shaded regions indicate ±1 SEM. The graph confirms the high discriminability of the responses elicited by the effective and ineffective stimuli. C, Scatter plot of the visual latencies of individual cells and the monkey's average standardized reaction times (RTs). Observe the highly significant correlation between the two measures. D, Scatter plot of the selectivity latencies of individual cells and the monkey's average standardized reaction times. Note that the relationship is even stronger than between visual latency and reaction times. In both scatter plots, the colors indicate from which condition the points came and the line is the best least-squares fit to the data.
A 是选择期群体平均 SDF(按有效/无效 × 四条件):注意方块与复杂遮挡条件下反应起步更晚——这是遮挡物造成的前向掩蔽,各条件视觉潜伏期约 118–150 毫秒不等。B 是群体滑窗 ROC,确认有效/无效反应高度可分。C、D 是两张散点图:横轴分别为每个细胞的视觉潜伏期与选择性潜伏期,纵轴为猴当日标准化反应时,颜色区分条件、直线为最小二乘拟合——D 中选择性潜伏期与反应时的相关(r=0.71)强于 C 中视觉潜伏期的相关(r=0.66)。此图支撑主要结果第 3 条:ITC 不仅编码选择刺激,其信号出现的时间本身就与行为决策快慢绑定。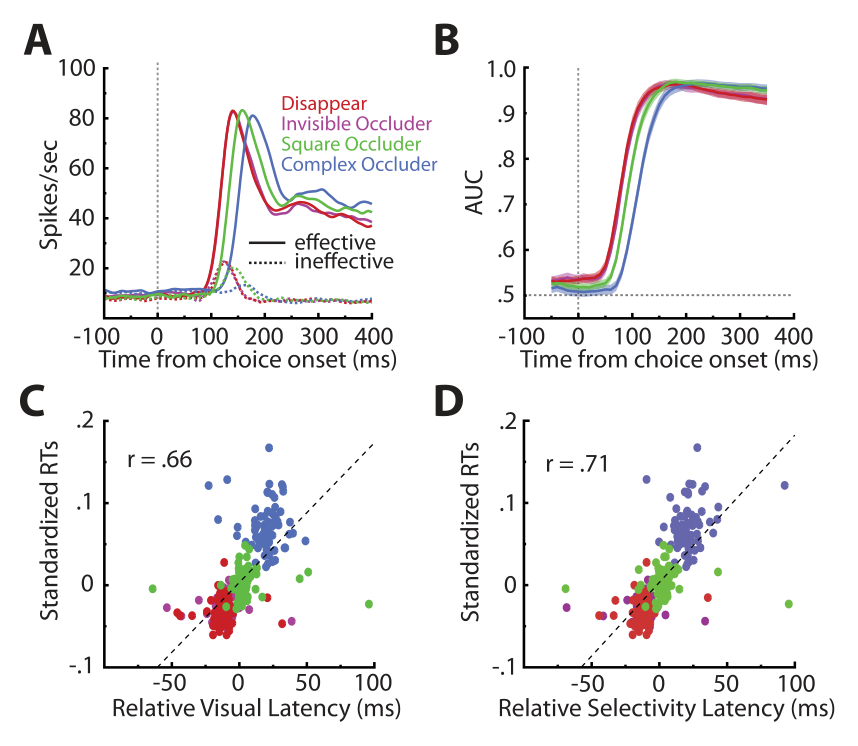
图 7 · 单细胞层面的匹配增强与匹配抑制
原文图注:Figure 7. Single-cell match enhancement and suppression effects. A, Population averaged spike density functions sorted by match status and condition, restricted to the effective stimulus. Note the large but delayed match suppression in all conditions. B, Zoomed in view of the spike density functions sorted by match status and condition. This plot reveals a small but reliable match enhancement in all conditions. C, Sliding window ROC analyses comparing match with nonmatch responses (step, 10 ms; window, 100 ms). Values above 0.5 indicate enhancement, whereas values below 0.5 indicate suppression. Shaded regions indicate ±1 SEM. The analysis confirmed an early match enhancement effect that was succeeded by match suppression. D, Match enhancement and suppression as a function of counting window. Shaded regions indicate ±1 SEM. In all conditions, we see a reliable match enhancement that is obscured by match suppression if the integration time is allowed to be long enough. The −log(p value) of Wilcoxon's signed ranks tests done on all data points indicate that indeed both enhancement and suppression were significant [the bottom dashed line indicates −log(0.05)] (for more details, see Results). E, The match enhancement was stimulus specific, because repeating the same analysis outlined in D on the ineffective stimulus yielded only match suppression. F, Scatter plot of match suppression latencies as a function of visual latencies. The dashed line is what would be expected if selectivity and suppression arose simultaneously. Match suppression is unlikely to be purely bottom up because, on average, it was delayed by 35 ms relative to the first sign of visual selectivity (p < 0.0001). Colors denote from which conditions the points came. (注:因篇幅对 D–F 的说明略有节选。)
A 是有效刺激按匹配状态分条件平均的 SDF:大规模的匹配抑制(非匹配反应高于匹配)清晰可见,但出现在反应峰之后。B 把时间轴放大,露出反应起点处小而稳定的匹配增强(匹配反应高于非匹配)。C 是匹配 vs 非匹配的滑窗 ROC(>0.5 为增强、<0.5 为抑制):所有条件都先有一段增强、随后翻转为抑制。D 把 AUC 按积分窗口长度展开(对齐各自视觉潜伏期前 25 毫秒起逐级加窗):增强出现在最初约 50 毫秒,窗口拉长即被抑制掩盖——"增强还是抑制"取决于积分窗口,这正是以往文献各执一词的原因。E 用无效刺激重复 D 的分析只见抑制:增强具刺激特异性。F 是匹配抑制潜伏期对视觉潜伏期的散点,多数点位于对角线上方,抑制平均晚于选择性 35 毫秒出现。此图是主要结果第 4 条的完整证据。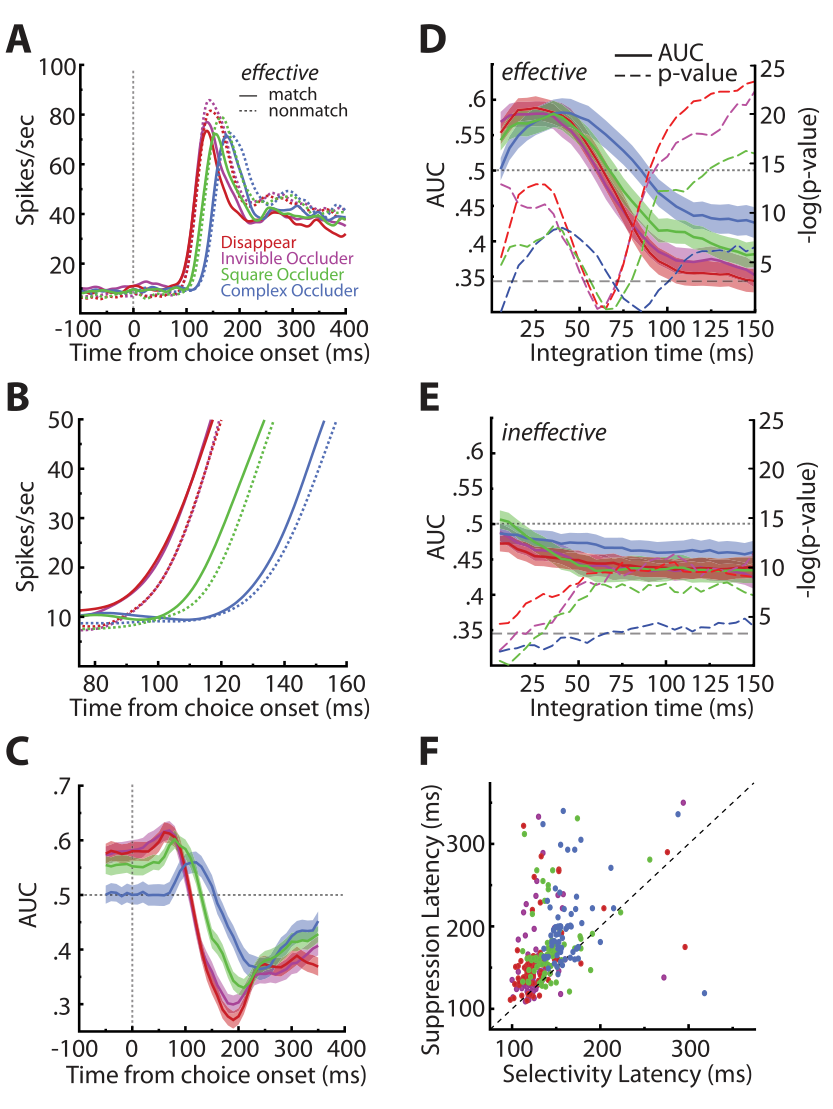
图 8 · LFP 匹配效应及其与尖信号效应的关系
原文图注:Figure 8. LFP match effects and their relation to spike match effects. A, Raw LFP waveforms averaged across all stimuli and sessions and sorted by match status and condition. Note the small but reliable differences in the match/nonmatch waveforms. B, LFP difference waveforms (match − nonmatch). Notice the consistent differences across the four conditions. C–F, t-transformed LFP differences (dark lines) and SDF differences (light lines). The times at which the LFP or SDF differences became significant is indicated by the dark or light bars, respectively, at the bottom of the plots. Note that, in all cases, the very first significant match effect was present in the single-cell responses. Also, observe that the LFP differences seem to be lagging the SDF differences.
A 是按匹配状态与条件平均的原始 LFP 波形:匹配/非匹配波形有小而可靠的差异。B 是差分波形(match − nonmatch),四个条件的不一致性更直观。C–F 是关键面板:把 LFP 差分(深线)与 SDF 差分(浅线)都做 t 变换后逐条件比较,图底部深/浅色条分别标出 LFP/SDF 差异达到显著的时刻——四个条件里,最早的显著匹配效应无一例外先出现在单细胞(尖信号)上,LFP 差异整体滞后。这一时序关系是"匹配增强源于 ITC 局部加工、而非上游信号灌入"这一推断的核心证据(主要结果第 5 条)。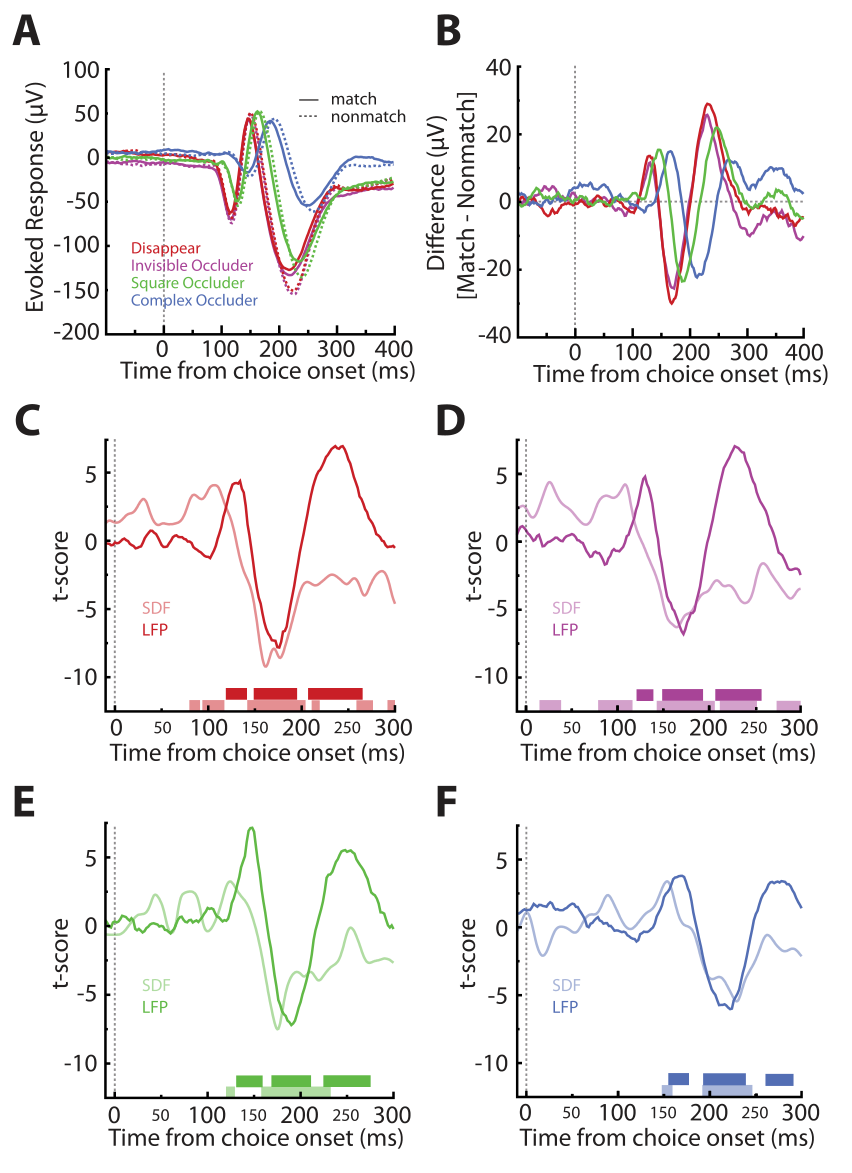
讨论
作者把发现嵌入"PFC 提供自上而下维持信号、后部感觉皮层持有内容"的框架:延迟期选择性的回升被解读为行为相关的视觉记忆在 ITC 中的重激活,而解剖上丰富的 PFC→ITC 反馈投射(Pandya and Yeterian, 1990)与 PFC 自身的预期性延迟活动(Rainer et al., 1999; Rainer and Miller, 2002)是这一重激活最顺理成章的来源;另一个候选反馈源是紧邻内侧的嗅周皮层(perirhinal cortex, PRh)——既往配对联想研究显示"检索信号"先现于 PRh、后至 ITC(Naya et al., 1996, 2001),且 PRh 与 ITC 的延迟期选择性均只为被搜寻目标、不为线索刺激而保持(Takeda et al., 2005),只是本任务里线索与目标同一,无法拆分两者贡献。对"复杂遮挡条件下延迟期选择性细胞为何骤减"作者给出三种解释:任务更难、重激活更费力——自下而上输入与短时记忆在 ITC 相遇时前者占优;群体解码显示不必依赖单细胞的强延迟放电——用 64 个细胞的联合信息已远胜单细胞,约 100 个选择性细胞即可匹配行为;以及最重要的第三种:不放电不等于未存储——Mongillo 等(2008)与 Sugase-Miyamoto 等(2008)的计算模型提出记忆痕迹可以隐式存在突触里、仅在回忆信号或新视觉输入到达时才以放电形式读出,这与复杂遮挡条件下"放电层面选择性被冲掉、匹配增强却在回忆时刻显影"的数据高度相容。匹配增强沿 Miller 与 Desimone(1994)的传统被解读为对任务相关表征的偏置增强(biased competition,Desimone and Duncan, 1995),本研究的增量在于证明这种增强只靶向表征该刺激所必需的细胞(无效刺激无增强)、因样本高选择性而比以往报道更明显、且大概率在 ITC 局部生成。作者也认真对待"这会不会只是知觉启动(perceptual priming)"的质疑:所有图片在 session 内反复出现,启动若存在只能按试次运作,这与"记忆痕迹在 ITC 重激活"的结论并不冲突,而尖信号先于 LFP 的事实进一步反对纯自下而上的解释。对匹配抑制,锋利化模型(sharpening,Desimone, 1996; Wiggs and Martin, 1998)本预测高选择性样本中抑制应当很小——数据相反,故作者转向"加工完成/促进"说(James et al., 2000; Grill-Spector et al., 2006; Freedman et al., 2006),三个佐证是:抑制晚于选择性 35 毫秒(此前的窗口足以传递行为相关信息)、抑制可靠地跟着增强走、以及 LFP 的第三个显著效应出现在尖信号抑制之后——抑制可能同样首先发生在 ITC 水平。结论重申:ITC 的延迟期选择性比例空前(计入全部显著调制细胞后消失与隐形遮挡条件分别达 45.6% 与 49.4%),非被动残余;干扰下被削弱但未被消灭;群体联合可大幅补强;早期匹配增强可能是与该行为任务最相关的信号;在 PFC 和/或 PRh 的调制性反馈协助下,ITC 既参与 VWM 的编码期,也参与对已不可见复杂视觉输入的暂时表征。
一句话总结
这篇是我读过的把"ITC 只管看、PFC 只管记"这种一刀切讲法撬得最松动的研究之一:延迟期选择性在近半数高选择性细胞里显著、群体解码能外推出行为水平、匹配增强还在 LFP 之前现身——三条证据合起来,"ITC 是物体工作记忆的现役成员"很难再被当作副产物打发掉。我最欣赏的是作者对"复杂遮挡条件下看不到延迟放电"的第三种解释——记忆可以暗藏在突触里、只在回忆瞬间读出:这个思路让"没放电"不再等于"没记住",也为后来"沉默保持"类研究预留了接口;当然,突触痕迹目前仍只是模型推论,文中并未直接测到。
审校与证据追溯 (Verification & Evidence)
图表审计结果
- Fig1: 提取质量
good,对齐度full,识别面板[A, B, C, D, E] - Fig2: 提取质量
good,对齐度full,识别面板[A, B] - Fig3: 提取质量
good,对齐度full,识别面板[A, B, C, D] - Fig4: 提取质量
good,对齐度full,识别面板[A, B, C] - Fig5: 提取质量
good,对齐度full,识别面板[A, B] - Fig6: 提取质量
good,对齐度full,识别面板[A, B, C, D] - Fig7: 提取质量
good,对齐度full,识别面板[A, B, C, D] - Fig8: 提取质量
good,对齐度full,识别面板[A, B, F]
关键事实与局限性声明
- 补充要点: 未报告论文中有关“物体永久性”操作无效的负结果。原作者在文中明确指出 'we found no systematic differences related to our permanence manipulations'。忽略该结果会导致对任务设计目的(为何引入隐形/可见遮挡物)的阐释有始无终,且可能让人误以为 ITC 神经元对“物体是否依然物理存在”这种高级认知概念有响应敏感度。