本文探讨人脑对周围环境几何结构的直觉感知来源。作者构建了 32 种房间布局与 3 种表面纹理交叉组合的 96 个系统化场景刺激,同步采集 fMRI 与 MEG 数据。研究发现,枕叶场景区(OPA)的神经响应模式编码空间布局,且对表面纹理变化具有不变性;这种纹理不变的布局编码在刺激呈现后约 100 ms 内即已形成,明显早于被试的眼动与行为反应。与更擅长解码纹理而非布局的海马旁回位置区(PPA)相对照,该结果为 OPA 表征环境几何结构提供了直接证据。
研究背景
看清房间的用途与识别行走路径属于不同的视觉判断。墙壁、地板与天花板构成的空间边界决定了通行范围,导航与空间定向研究因而长期关注环境几何结构。随着场景功能成像的发展,海马旁回位置区(PPA)、枕叶场景区(OPA)和压后皮层(RSC)被发现对场景具有优先响应,研究进而聚焦于这些脑区对空间布局、开放程度及边界高度等属性的敏感性差异。有关 OPA 的功能角色尤为值得深入探讨:已有研究发现该区域与可行走路径密切相关,经颅磁刺激研究也提示其参与利用边界信息完成导航。然而,某一脑区参与场景加工,并不等同于它能将空间布局从具体的图像外观中独立表征出来。
在自然照片刺激下,这一问题难以厘清。房间几何结构改变时,纹理、光影与局部图像统计特征往往同步变化;从神经活动中区分两个场景,可能仅反映了表面特征的差异。若要证实纯粹的几何编码,必须证明同一种空间布局在替换不同纹理后,其表征仍能稳定读出。同时,布局信息形成的时间进程具有重要理论意义:若导航所需的环境结构在极早期即可提取,便符合快速前馈计算的特征;若需较长时间方能稳定涌现,则需要考虑更多迭代或反馈加工。fMRI 擅长空间定位,却无法解析毫秒级时间动态;MEG 能追踪时程,但难以仅凭传感器信号精确定位具体的场景响应区。因此,严格控制刺激维度并建立跨测量方法的对应关系十分必要。
本研究通过系统开关五种边界元素,构建出 32 种空间布局,并与 3 种表面纹理完全交叉,检验基于单一纹理学得的布局分类能否泛化至其他纹理,同时对比各皮层区域与全头 MEG 信号的表征结构。该设计将“在何处区分布局”与“何时出现相应信息”纳入同一实验框架,并量化评估了后墙、地板等元素的不同贡献。需指出的是,本实验的检验范围基于二维渲染图中的局部空间布局,并非真实环境中的导航行为;纹理变换类型有限,后墙有无伴随知觉深度的改变,地板效应亦可能包含视野下半区的加工偏置。早期神经表征与跨纹理泛化虽支持了表征的快速性与外观容忍度,但仍不能单独排除所有图像混淆,亦未证明纯前馈机制。
研究思路
作者的核心策略是结合全因子刺激空间、双模态成像与表征模型比较。刺激构建上,利用 3D 建模软件 Blender 系统生成刺激集:独立开关左墙、后墙、右墙、地板、天花板五个场景边界元素,构建出 2⁵ = 32 种全部可能的空间布局;随后叠加空房间、栅栏、城市空间三种表面纹理渲染,得到 96 张场景图像。该完备集合带来三项优势:空间布局与表面纹理完全正交解耦;可通过跨纹理分类泛化检验(即在一种纹理下训练线性分类器,在另一纹理下测试)验证布局表征的纹理不变性,从而排除低级图像特征差异的干扰;可量化评估五个边界元素对神经表征的独立贡献。
数据采集同时采用 fMRI(毫米级空间分辨率,分辨 V1、OPA、PPA 内部的模式表征)与 MEG(毫秒级时间分辨率,追踪布局编码的动态涌现)。两模态通过表征不相似度矩阵(RDM)实现对齐:首先利用 Kendall tau-a 等级相关评估 MEG 随时间演变的 RDM 能被哪个 fMRI 感兴趣区(ROI)的 RDM 解释;进而引入一组竞争模型(低级图像特征模型 GIST、等权重汉明距离模型、逐元素拟合权重的布局模型、空间开放度模型以及元素交互模型)拟合皮层与 MEG 的 RDM,解析表征几何的具体构成。行为层面则安排了前置的眼动追踪实验,考察自由观看状态下被试对各场景区域的注视偏好。
方法
实验共招募 22 名健康志愿者(9 名女性,平均年龄 26 岁,范围 19–49 岁),均完成眼动行为实验、一次 MEG 实验以及分两次进行的 fMRI 实验(另招募 2 人因未完成双模态实验而被剔除)。fMRI 数据在 3T Siemens Skyra 扫描仪上采集(EPI 序列,TR 2 s,29 层,层厚 2 mm,FOV 192 mm,矩阵 96×96),采用快速事件相关设计:刺激呈现 2 s,随后注视十字 2 s;单次 run 包含 96 张刺激图像各一次,混入 32 个 4 s 静息试次和 10 个行为任务试次(刺激呈现后偶尔出现指向五个方向之一的箭头,被试按键判断先前场景对应方向是否存在边界元素),共完成 12 个 run(每种刺激重复 12 次),跨两次扫描。刺激以注视点为中心,视角约 20°×20°。感兴趣区(ROI)由独立定位任务确定:V1 依据皮层解剖沟回(FreeSurfer 表面皮层对齐);OPA、PPA 与 RSC 则通过独立的场景定位实验确定(包含场景、面孔、物体和打散纹理的 block 刺激,执行 one-back 任务),依据“场景 > 面孔”对比手动勾画,左、右半球体素合并分析。
fMRI 分析方法:针对每对布局刺激,利用 Fisher 线性判别器在奇数 run 上训练、偶数 run 上测试(折半交叉验证),计算线性判别 t 值(LDt,即交叉验证归一化的马氏距离);在个体水平计算后汇总 22 名被试数据,32 种布局对应的 496 个两两对比均通过 FDR 控制多重比较。跨纹理泛化分析采用“一种纹理训练、另一纹理测试”的方式。MEG 实验在磁屏蔽室内采用 306 通道全头系统记录(分析仅使用 204 个平面梯度计,采样率 1000 Hz,经 MaxFilter 时空信号空间分离与 ICA 去除眨眼伪影),进行 −200 至 0 ms 单试次基线校正和 45 Hz 低通滤波;刺激呈现 1 s,刺激间隔(ISI)为 2 s,共记录 8 个 run(每种刺激重复 8 次)。MEG RDM 基于留一交叉验证马氏距离(LDC)逐时间点构建,与 fMRI RDM 或模型 RDM 进行 Kendall tau-a 相关比较,被试间采用双侧符号秩检验并进行跨时间点的 FDR 校正。模型拟合采用非负最小二乘法,权重计算采用留一被试交叉验证。
主要结果
-
OPA 解码布局优于解码纹理,V1 与 PPA 则相反。分析“同纹理不同布局”(布局解码)与“同布局不同纹理”(纹理解码)刺激对的平均判别力(LDt)显示:V1 与 PPA 的纹理解码水平均显著高于布局解码;而 OPA 则表现出相反趋势,其布局解码表现显著优于纹理解码(图 2)。此外,PPA 对“布局与纹理均不同”刺激对的判别力系统性高于“仅布局不同”的刺激对,表明 PPA 的神经表征主要受纹理驱动,参与基于表面纹理的场景类别加工,而非纯粹的几何布局表征。
-
OPA 的布局判别可跨纹理泛化,V1 与 PPA 则无法泛化。在 V1 中,不同布局虽诱发可区分的响应模式,但分类器在不同纹理间测试时分类性能降至基线,表明其判别力主要来源于特定纹理下的低级图像特征差异;而在 OPA 中,分类器能够稳定地跨纹理泛化,证实其表征具有纹理不变的几何特性;PPA 对布局刺激虽有一定响应,平均判别力高于随机水平,但绝大多数布局对的模式差异未达显著水平(图 3C、图 4)。汇总 RDM 与多维尺度(MDS)分析进一步表明:后墙元素对三个脑区的模式区分度贡献最大(后墙占据中央视野且面积最大);在 OPA 中,仅天花板有无差异的场景对表现出高度相似的模式,显示天花板贡献较弱,同时边界元素的总数也调制了表征的区分度。
-
纹理不变的布局表征在刺激呈现后约 100 ms 内迅速涌现。V1 与 OPA 的 fMRI RDM 均与全头 MEG RDM 存在显著相关;将 MEG RDM 拟合为 V1 与 OPA fMRI RDM 的线性组合后,OPA 的独立解释贡献自刺激呈现后 60 ms 即达到显著水平,并在约 100 ms 处达到峰值(双侧符号秩检验,FDR 0.01)。更为关键的是,在基于跨纹理泛化判别构建的 RDM 中,仅 OPA(而非 V1 或 PPA)与 MEG 信号显著相关,该相关自 65 ms 开始显著并在约 100 ms 达峰,表明 MEG 捕捉到的正是 OPA 所具有的表面纹理不依赖的布局编码,且其神经计算具有高度的时间敏感性(图 5B、C)。
-
几何布局模型对 OPA 表征几何的解释优于低级特征模型 GIST。模型对比结果显示(图 6 定义了等权汉明距离模型 ewalls、逐元素拟合模型 fwalls、空间开放度模型 nwalls 及低级特征模型 GIST):V1 的表征结构能被 GIST 模型最佳预测;而在 OPA 中,fwalls 模型的拟合度显著优于 GIST 模型,在 fwalls 基础上叠加 GIST 并未进一步提升解释方差(而在 V1 中叠加则有提升);引入 nwalls 能够显著提高 OPA 的拟合方差,表明空间开放度同样在 OPA 中被编码;PPA 的最优拟合则需要 GIST、fwalls 与 nwalls 的联合模型,引入元素间交互项未带来显著提升。在 MEG 时间进程上,早期信号以 GIST 成分为主导,但边界几何成分自早期即提供显著的附加方差并在约 100 ms 处达到峰值,开放度 nwalls 的附加贡献则主要出现在中晚期(图 7)。
-
地板元素在 OPA 表征中具有独特地位,与眼动注视行为相契合。逐成分独立方差分析(留一法)显示:GIST 成分在 V1 中解释的独立方差占据主导;在 V1 与 OPA 中,后墙的方差贡献均大于其他边界元素;而在 OPA 中,地板成分的贡献显著高于左墙、右墙及天花板(FDR 0.05),该模式在 MEG 数据中得到一致验证。行为层面,在扫描前开展的自由观看实验中,被试对场景下方区域(尤其是地面)的注视显著多于天花板区域(三种纹理下 FDR 分别为 0.0035、0.0077、0.003),提示视觉注意自发偏向地面等与可行走性相关的几何结构(图 8,行为数据见补充材料)。
图注解读
图 1 · 完备的场景布局刺激集
原文图注:Figure 1. Stimuli to Test the Hypothesis that Human Scene-Responsive Cortical Areas Encode Scene Layout (A) The spatial layout of a room is captured by fixed scene-bounding elements, such as the walls. (B) We created a complete set of spatial layouts using 3D modeling software by switching on and off the five bounding elements: left wall, back wall, right wall, floor, and ceiling. (C) For example, by switching off the back wall and the ceiling, we create a long, canyon-like environment. (D) Textures and background images were added to the scenes to enable us to discern layout representations from low-level visual representations. (E) The complete set of scenes included 32 different spatial layouts in 3 different textures, resulting in 96 scene stimuli.
读图要点:(A) 明确房间布局由固定边界元素定义的核心概念;(B) 说明利用 3D 建模软件独立开关五个边界元素;(C) 呈现代表性样例,例如移除后墙与天花板即可构建峡谷状通道环境;(D) 阐明叠加纹理与背景图像的目的,即将空间布局表征与低级视觉特征解耦;(E) 汇总展示全部 32 种布局 × 3 种纹理构成的 96 个刺激全集。该设计确立了全因子刺激空间,为结果 1 和结果 2 的因果推论奠定方法学基础。
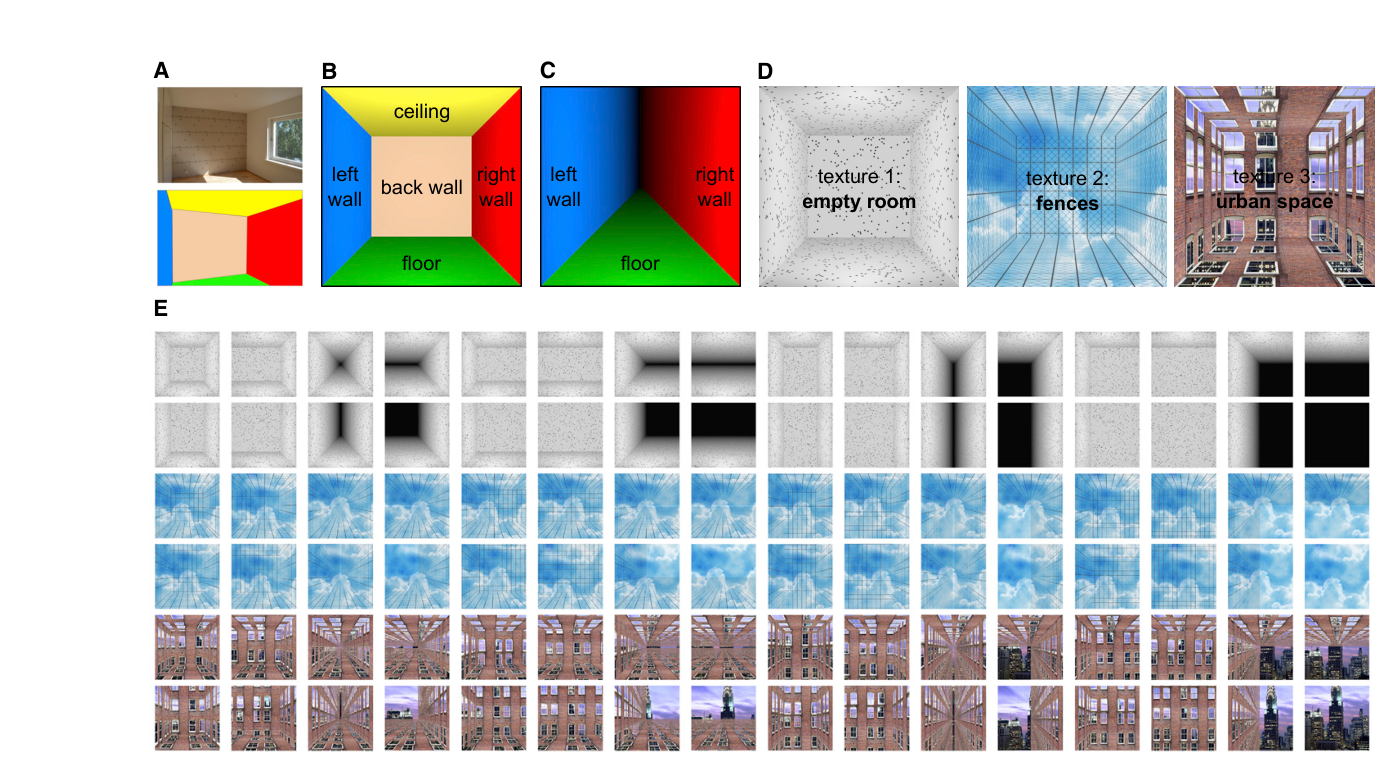
图 2 · 布局解码与纹理解码的对比
原文图注:Figure 2. Layout versus Texture Decoding The average discriminability across all scene pairs that differ in the layout but are of the same texture (layout decoding; gray bars) and all scene pairs that have the same layout but differ in the texture (texture decoding; black bars) are shown separately for the V1, OPA, and PPA. In the V1 and PPA, a change in texture had, on average, a larger effect on the discriminability of the fMRI response patterns than a change in layout, whereas the opposite was true for the OPA. The p values are from two-tailed signed-rank tests across the 22 subjects; the error bars indicate SEM across the subjects. See Figure S1 for average fMRI responses for all 96 individual stimuli for each region of interest and Figure S2 for fMRI response pattern discriminability separately for each stimulus pair.
读图要点:横轴对应 V1、OPA、PPA 三个感兴趣区,纵轴表示平均判别力(LDt);灰色柱代表布局解码(相同纹理、不同布局的场景对均值),黑色柱代表纹理解码(相同布局、不同纹理的场景对均值),误差棒表示 22 名被试的 SEM,p 值基于双侧符号秩检验。对比两类柱状高度可见:V1 与 PPA 的黑色柱更高(纹理诱发的模式差异更大),而 OPA 的灰色柱更高(布局模式差异显著大于纹理差异)。该图给出了区域间的功能分离,支撑结果 1。
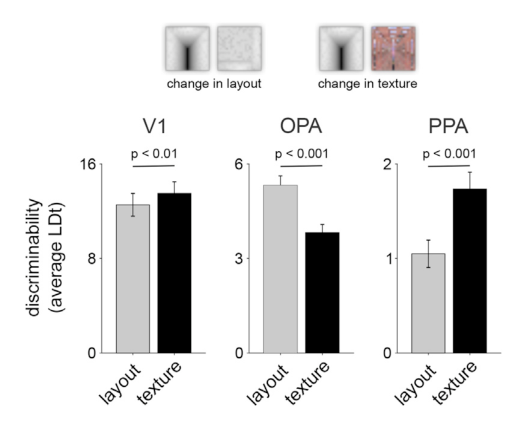
图 3 · 布局判别的跨纹理泛化检验
原文图注:Figure 3. Discriminability of the fMRI Response Patterns for Each Pair of Layout Stimuli in the V1, OPA, and PPA and Generalization of the Result across Textures (A) The discriminability of the layout stimuli from the fMRI response patterns was evaluated for each pair of the 32 layouts, separately for the three textures. The Fisher linear discriminant was fitted to response-patterns obtained from training data (odd fMRI runs) and the performance was evaluated on independent testing data (even fMRI runs). The results are shown as linear discriminant t values (LDt; Nili et al., 2014; Walther et al., 2016). The analyses were done on individual data, and the results were pooled across subjects. (B) The generalization of the layout discrimination across different surface textures was evaluated by fitting the Fisher linear discriminant to response patterns corresponding to a pair of layouts in one texture and evaluating the performance on the response patterns corresponding to the same layout pair in another texture. All combinations of texture pairs were evaluated. A high LDt value suggests successful generalization of layout discrimination across surface textures and, hence, a layout representation that is tolerant to a change in surface texture.
读图要点:上排展示 32×32 的 LDt 判别矩阵,对角线上的三个子矩阵分别对应三种纹理内部的布局判别,六个非对角子矩阵对应跨纹理泛化测试(在一种纹理下训练、在另一种纹理下测试相同布局对);下排为对应的 FDR 显著性矩阵(n.s. 表示未达显著)。数据规律显示:V1 呈现对角线显著而非对角线不显著,表明分类依赖低级图像特征而无法跨纹理泛化;OPA 的对角线与非对角子矩阵均保持高度可分,证实其表征具有纹理不变性;PPA 仅有个别元素显著,多数布局对无法区分。该图为 OPA 编码空间布局本身提供了直接证据,支撑结果 2。
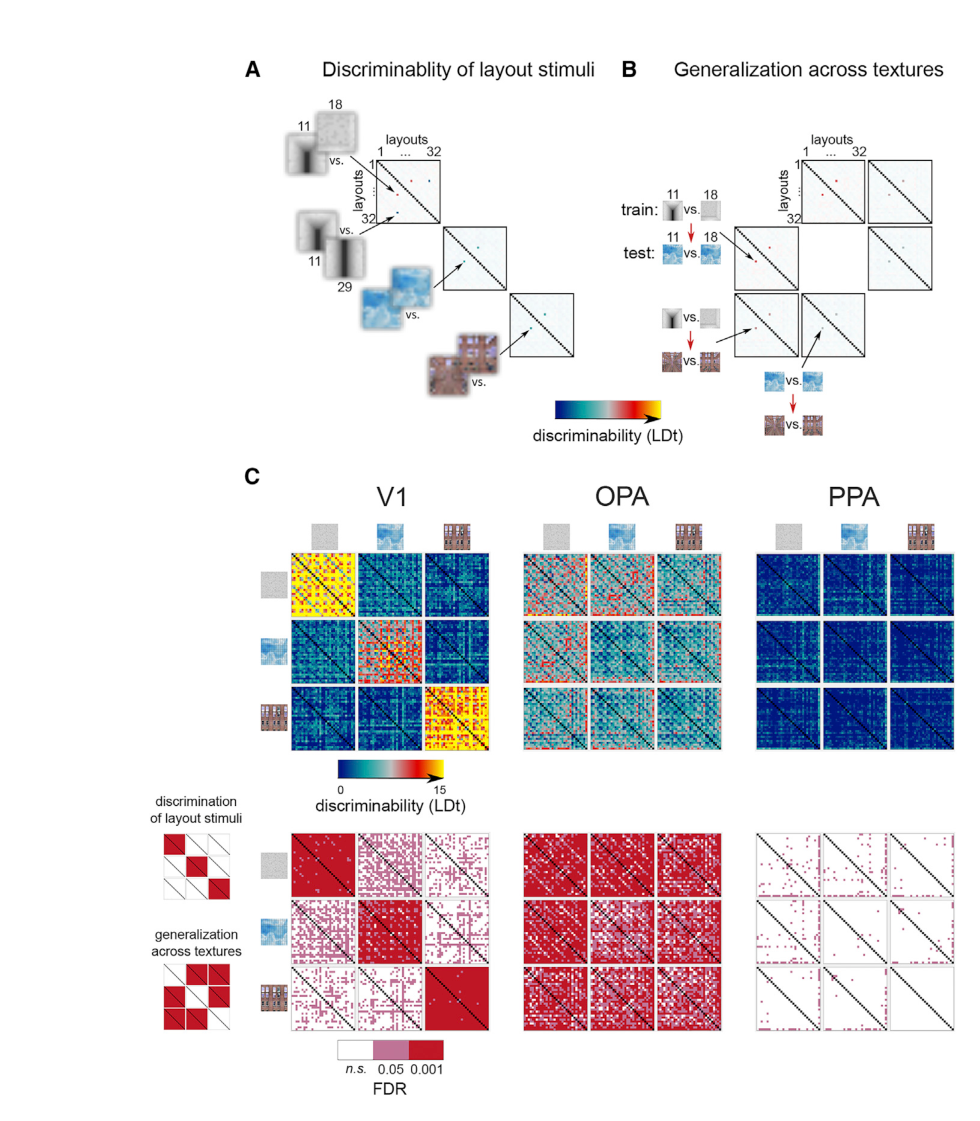
图 4 · 表征几何的汇总:布局泛化在 OPA 成立
原文图注:Figure 4. Representational Geometry of Scene Layouts Generalizes across Textures in the OPA (A) The distinctiveness of the fMRI response patterns for the spatial layouts are shown, as captured by the LDt values. The analyses done separately for the three textures were averaged (shown separately in Figure 3). The bottom row shows the corresponding FDRs (two-tailed signed-rank test across 22 subjects). (B) The generalization performance of the discriminant across different textures was evaluated by fitting the linear discriminant to a pair of spatial layouts in one texture and testing the discriminant on the same pair of layouts in another texture. The analysis was done for each combination of textures, and the results were averaged (shown separately in Figure 3). The bottom row shows the corresponding FDRs. In the OPA, the representation shows texture invariance. The multidimensional scaling visualizations of the distinctiveness of the response patterns are shown in Figure S3.
读图要点:将图 3 中各纹理的判别结果在 V1、OPA、PPA 三个区域内分别计算均值,生成汇总 RDM:(A) 为纹理内判别,(B) 为跨纹理泛化判别,底排展示对应的 FDR 显著性矩阵,色阶表示 LDt 强度。对比三个脑区可见:V1 在泛化测试 (B) 中的判别力较 (A) 显著减弱;OPA 在两种测试中均表现出稳定的模式区分度;PPA 在两种条件下判别水平均较低。此外,后墙所在的行列在所有区域均表现出较强的模式区分度(因其覆盖视野中心且投影面积最大);在 OPA 中,仅缺少天花板的场景对反应模式高度相似。该图支撑结果 2 及后墙主导、天花板弱贡献的观察。
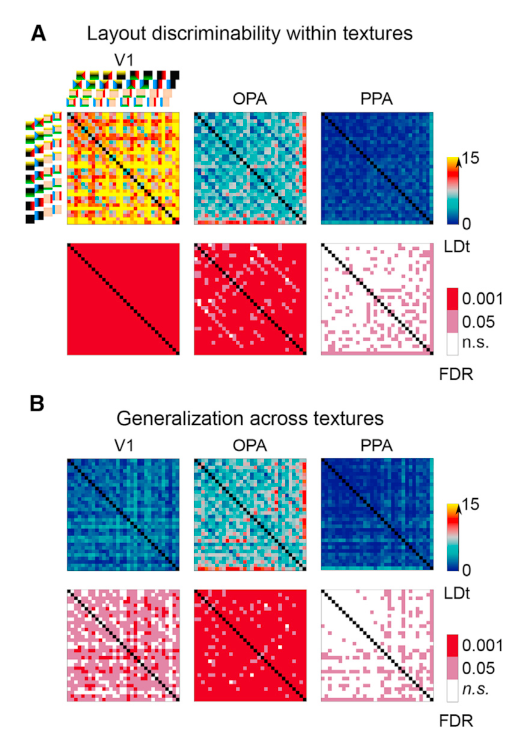
图 5 · OPA 的 fMRI 表征与 MEG 时间动态的早期对应
原文图注:Figure 5. Early Correspondence between the Representations in the OPA (fMRI) and MEG (A) The Kendall tau-a rank correlations between the MEG RDMs and fMRI RDMs are shown. The top panel shows the full time course (stimulus-on period indicated by the black bar), and the bottom panel highlights the early time window. The black line shows the correlation between the MEG and V1-fMRI, and the dark red line shows the correspondence between the MEG and OPA-fMRI. The correspondence between the MEG RDMs and cross-validated fitted linear combinations of multiple fMRI RDMs are also shown (light red line for the V1 and OPA and blue dashed line for the V1, OPA, and PPA). The analyses were done separately for each subject and for each texture, and the results were averaged. Significant time points are indicated by thick lines (FDR of 0.01; p values were computed with two-tailed signed-rank test across the 22 subjects, FDR adjusted across time points). The gray line indicates the amount of replicable structure in the MEG RDMs across subjects. Figure S4 evaluates the effect of the distance estimator for the reliability of the RDMs. (B) The OPA significantly adds to the V1 in explaining the MEG RDMs already in the early time window after stimulus onset. Shaded regions indicate SEM across subjects, and a red line indicates an FDR rate of 0.01
读图要点:(A) 呈现 MEG RDM 与各 fMRI RDM 的 Kendall tau-a 相关随时间变化的动态轨迹:黑线代表 V1-fMRI,深红线代表 OPA-fMRI,浅红线与蓝色虚线分别代表 V1+OPA 以及 V1+OPA+PPA 的组合拟合,灰色线标示 MEG RDM 跨被试可复现的上限,加粗线段表示经 FDR 0.01 校正的显著时间窗。(B) 展示控制 V1 影响后 OPA 拟合 MEG RDM 的独立方差贡献时程:显著起始点约为 60 ms,峰值出现在约 100 ms,阴影表示被试间 SEM,红线表示 FDR 0.01 阈值。(C) 展示跨纹理泛化 RDM 与 MEG RDM 的相关时程:仅 OPA 呈现显著相关(约 65 ms 起始、约 100 ms 达峰),V1 与 PPA 均未达显著。该图将解剖定位(OPA)与时间进程(约 100 ms 内)相整合,支撑结果 3。
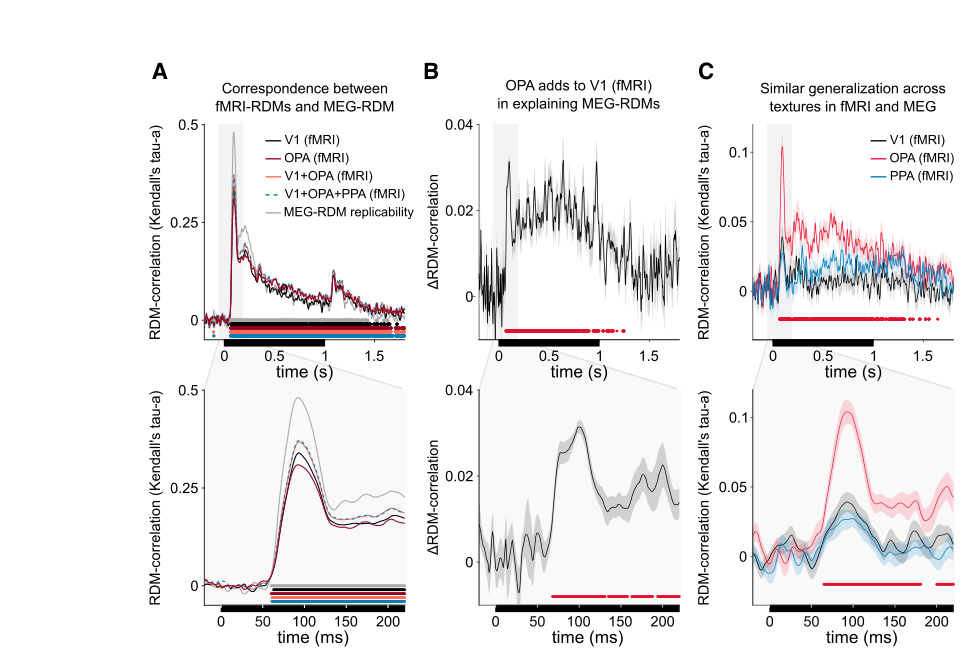
图 6 · 表征几何的模型成分
原文图注:Figure 6. The Representational Geometries Were Modeled as Linear Combinations of Representational Components The first three model-RDMs capture the GIST features (Oliva and Torralba, 2001) of the stimuli (low-level image feature similarity), shown separately for the three different textures. The next model predicts the responses for a scene layout-based representation with equal contribution of all walls, calculated as the Hamming distance between the layouts (the percentage of the same boundaries present in a pair of scenes, predicting a similar response to two scenes with the same boundaries and a distinct response for a pair of scenes with different boundaries). The last model in the top row was constructed based on the number of scene-bounding elements present in each scene (a similar response to a pair of scenes with the same number of scene elements present in the scene), roughly reflecting the size of the space. The center row shows the five model-RDMs separately capturing the presence of each of the five scene-bounding elements in the spatial layouts. The last ten model-RDMs reflect the interactions between the walls.
读图要点:本图系统列出用于模型比较的候选表征矩阵:顶排前三项为针对三种纹理分别提取的 GIST 低级特征 RDM;随后为等权重汉明距离模型 ewalls 与边界数量模型 nwalls(依据场景中边界元素数量预测相似性,反映空间开放度);中排为分别对应五个边界元素的 fwalls 单元素模型 RDM;底排十个子图对应边界元素间的两两交互 RDM。各模型经非负最小二乘拟合并通过留一交叉验证与神经 RDM 对比,构成了图 7 和图 8 分析的计算基础。
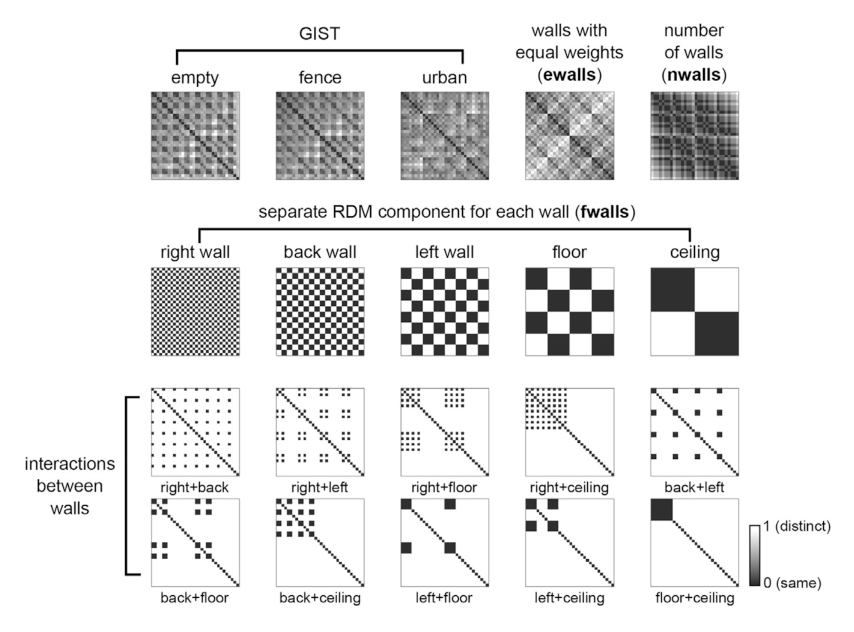
图 7 · 各模型对 fMRI 与 MEG RDM 的解释力
原文图注:Figure 7. The Contributions of Low-Level Image Differences and True Scene Layout-Based Representations in the fMRI and MEG RDMs (A) The mean Kendall's tau-a correlation between the models and fMRI RDMs are shown separately for the V1, OPA, and PPA. In the V1, there is only a small improvement in the correlations when the GIST model is complemented with other models. In the OPA, the fitted combination of scene-bounding elements model (fwalls) alone already explain the representation better than the GIST model. The gray lines indicate the amount of replicable structure in the fMRI RDMs across subjects. The error bars indicate SEM across the subjects. (B) Pairwise comparisons between the models, shown separately for the V1, OPA, and PPA. The color codes and order of the models is the same as in (A). Dark gray indicates a significant difference between the models (two-tailed signed-rank tests across the 22 subjects, multiple testing accounted for by controlling the FDR at 0.01), light gray indicates non-significance.
读图要点:(A) 呈现七个候选模型(GIST、nwalls、ewalls、fwalls、GIST+fwalls、GIST+fwalls+nwalls 及其交互项)对 V1、OPA、PPA 三个区域 fMRI RDM 的平均拟合度(Kendall tau-a),灰线表示神经 RDM 的可靠性上限。(B) 为各模型间的两两对比矩阵,深灰色表示在 FDR 0.01 水平下差异显著,浅灰色表示未达显著。对比显示:在 V1 中 GIST 模型已接近上限,引入几何模型改善有限;在 OPA 中 fwalls 模型表现显著优于 GIST 模型,且叠加 GIST 未显著提升拟合度,而引入开放度 nwalls 则显著提高拟合表现;PPA 则需要全成分联合模型达到最优。(C)–(E) 将模型比较拓展至 MEG 时间维:(C) 各模型的时程曲线;(D) fwalls 在 GIST 之上的独立附加方差约在 100 ms 达到峰值;(E) 开放度 nwalls 的独立贡献主要出现在中晚期。该图支撑结果 4。
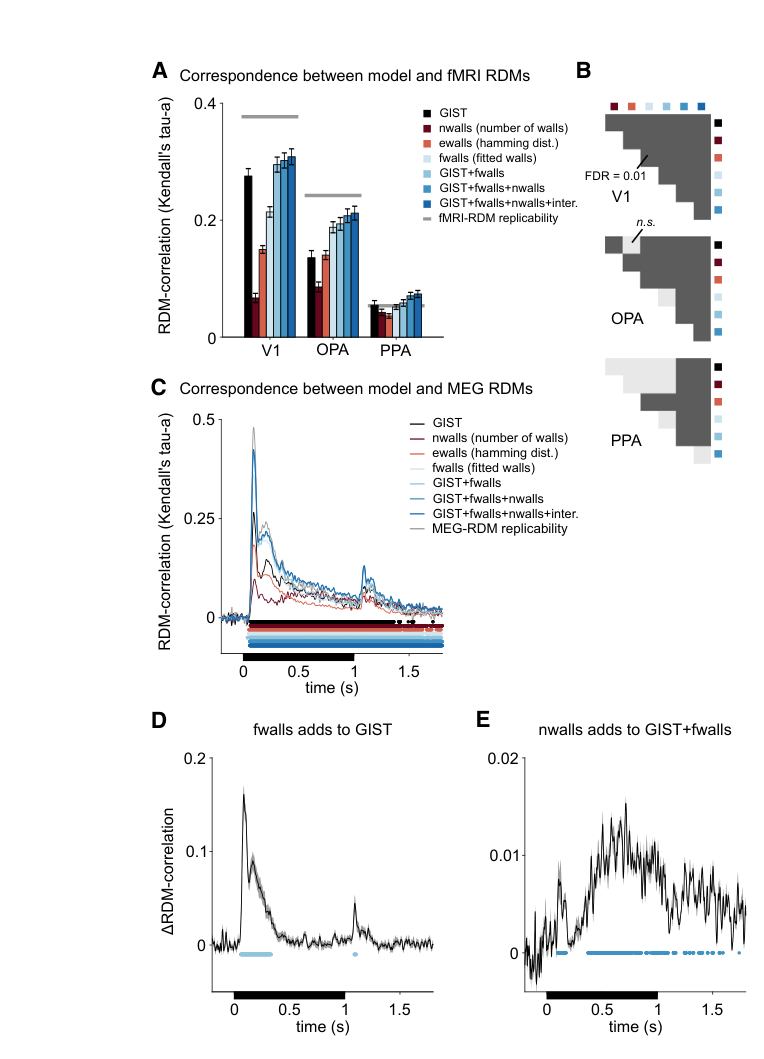
图 8 · 逐成分的独特解释方差
原文图注:Figure 8. The Unique Variance Explained by Each Model Component (A) The explained variance (R2 adjusted) of the fitted joint models containing components for the five scene-bounding elements (black bars and line for fMRI and MEG, respectively), components for the five scene-bounding elements and the GIST (dark gray bars and line), and components for the five scene-bounding elements, the GIST, and the number of walls (light gray bars and line). The red lines indicate a significant improvement compared with a model with fewer components (one-tailed signed-rank tests across the 22 subjects, multiple testing within a region of interest or across time points accounted for by controlling the FDR at 0.05). See Figures S5 and S6 for the results for each texture separately and also including the component models for interactions between walls (overall no further improvement in the adjusted explained variance). (B and C) The gain in variance explained by each of the model components was calculated by comparing the explained variance between the full model (light gray in A) with a model where this one component was left out from the joint fit. Each model component was left out in turn, and the results are shown separately for (B) V1, OPA, and PPA (fMRI) and (C) MEG data. Error bars (fMRI) and shaded regions (MEG) are SEM across subjects.
读图要点:(A) 比较三层嵌套联合模型在 fMRI(柱状图)与 MEG(折线图)中的校正解释方差(调整 R²),层级包含基础五元素模型、叠加 GIST 模型及进一步叠加 nwalls 模型,红线标注显著优于少成分模型的检验结果(FDR 0.05)。(B) 与 (C) 呈现“留一成分”方差分解结果,即从完整模型中逐一移除某一成分评估其独立方差损失(ΔR²),分别对应 fMRI(B)与 MEG(C)。结果显示:GIST 成分在 V1 中的独立方差远超几何成分;而在 OPA 中,后墙贡献最高,地板的解释方差显著大于侧墙与天花板;MEG 的时程分解与 OPA 表现出高度一致性,地板的突出贡献亦与眼动实验中对地面的注视偏好相印证。该图支撑结果 5。
讨论
本研究的实证结果表明:OPA 专门从视觉输入中提取场景边界元素的空间布局,其神经表征支持对边界存在性的线性读出,且对表面纹理变化具有容忍度;V1 的表征模式主要受低级图像特征模型 GIST 解释;PPA 的模式反应未能稳定区分多数空间布局,其纹理解码表现更佳,且对“布局与纹理双重差异”的敏感性支持其主要参与基于表面特征的场景类别识别。这一发现与 Julian 等人(2018)提出的“OPA 解析局部空间要素、PPA 参与场景识别”的功能分工假说高度一致,也与 OPA 存在下视野偏置及外周视野偏好的解剖学特征相印证(Silson et al., 2015; Levy et al., 2001, 2004)。作者借鉴其先前提出的面孔拓扑图假说(faciotopy)推论:场景响应皮层可能同样由早期视网膜拓扑投射发育而来,逐步分化出放大表征关键生态特征(如脚下地面)的空间几何图谱。针对计算机生成图像的计算建模研究(Lescroart & Gallant, 2019),本文的贡献在于揭示了 OPA 与 PPA 的功能分离(仅 OPA 呈现纹理不变的布局表征),并测定该表征在 MEG 中约 100 ms 内迅速涌现,为 Bonner 与 Epstein(2018)提出的“前馈网络可高效提取空间布局”的观点提供了直接神经时程证据。
作者同时指出了本研究的局限性:刺激材料采用二维平面渲染图像,尚非真实立体或虚拟现实环境;为维持刺激空间的完备性,所有布局组合的呈现概率均等,未考虑真实物理世界中布局的自然先验分布;纹理变换类型有限,空间布局的改变伴随了知觉深度的潜在共变(如移除后墙可能增加纵深感);地板元素的突出贡献究竟源于地面几何本身的生态重要性,抑或由视野下半区的神经偏置所驱动,仍有待后续研究进一步厘清。
一句话总结
本研究通过完全交叉的刺激空间设计,将纹理不变性确立为可严格验证的泛化特征,并借助 fMRI 与 MEG 的时空表征对齐,定位了空间几何表征的皮层分布与百毫秒级动力学。研究清晰分离了 OPA 与 PPA 的功能计算特性:OPA 专注于提取不依赖表面外观的空间布局几何,而 PPA 则主要表征依赖表面纹理的场景类别。