该研究结合行为筛选、大规模电生理记录与深度卷积神经网络建模,实证检验循环计算在核心物体识别中的作用。作者首先筛选出灵长类能高效识别但前馈深度网络无法正确分类的"挑战图像",继而通过 Utah 阵列记录猕猴下颞叶(IT)皮层群体活动,发现此类图像达到行为充分水平的信息解码平均滞后约 30 ms,且该晚期响应模式是纯前馈模型预测准确率最低的部分。该工作将循环回路(recurrent circuits)的必要性转化为量化指标,并为循环神经网络的计算约束提供了直接基准。
研究背景
灵长类能在一次短暂注视中辨认物体,IT 群体的早期活动已包含大量可用线性方法读出的身份信息。由于核心识别发生得很快,一种有影响的零假设认为,它主要由前馈级联完成,皮层间反馈和局部循环更多服务于较慢过程。深度卷积网络(DCNN)以基本前馈的架构就能近似许多 IT 响应和行为结果,似乎支持这一观点。但真实腹侧流存在广泛循环连接,而 DCNN 对逐图行为难度和 IT 晚期动态仍解释不全。因此,问题不是脑中有没有反馈,而是反馈是否在约 200 毫秒内对识别行为作出必要贡献。
回答这一问题需要找到合适的探针。笼统比较“遮挡图”或“杂乱图”并不能保证它们真的需要循环加工,也可能只反映低阶难度。更直接的做法是逐图比较灵长类与前馈模型:筛出模型表现差而灵长类表现好的挑战图像,再检查这些图像是否在 IT 中需要更晚才能达到行为充分的解码水平。以往的宽时间窗分析无法精确估计每张图的解出时刻,也难以排除某些图片只是视觉驱动起始较晚或对比度较低。
本文据此把行为筛选、大群体 IT 记录和模型预测连接起来。物体解出时间(OST)定义为 IT 解码达到猴子该图行为水平的时刻,挑战与对照图像的 OST 差可检验额外加工需求;V4 和 IT 起始潜伏期用于排除输入变慢,后向掩蔽则检验晚期加工对行为的重要性。前馈、更深及循环模型对晚期 IT 响应的预测提供另一条交叉证据。研究支持循环参与,但并未确定循环位于 IT 内部、腹侧流反馈还是下游前额叶,更深前馈模型的改善也说明“额外非线性变换”与解剖循环不能仅凭时间延迟等同。
研究思路
研究设计建立在三步递进的检验链条上。首先,若循环计算对核心物体识别必不可少,应当存在部分图像:前馈神经网络(作为腹侧流通路的计算近似)无法正确分类,而灵长类能够稳定识别。为避免主观设定特定图像类型(如简单归纳为遮挡或背景杂乱),作者采用数据驱动的策略,在二元物体辨别任务中逐图对比猕猴、人类与 AlexNet 的行为表现,据此分离出“挑战图像”(challenge images)与“对照图像”(control images)。其次,若此类图像依赖循环计算,其效应应反映在神经反应的时程动态上,即挑战图像在 IT 群体中达到与行为相当的线性解码精度所需的时间应显著滞后。最后,前馈模型对与行为表现相关的 IT 晚期神经模式预测能力应当下降,而具备循环连接或更深计算层级的模型应能提供更好的拟合,从而在计算模型层面形成约束。
研究将循环机制的操作化指标界定为两项:一是逐图的物体解出时间(object solution time, OST),定义为 IT 群体线性解码准确率达到该图片对应行为辨别力水平的时间点;二是各计算模型随时间推移对 IT 神经响应解释方差的动态变化。通过以行为准确率为锚点,排查晚期神经活动仅为副现象的解释。
方法
行为实验:共采用 1,320 张测试图片(其中 1,120 张为计算机合成图片,包含熊、大象、人脸、苹果、汽车、狗、椅子、飞机、鸟、斑马 10 个类别各 112 张,施加了空间位置、视角旋转与尺寸变换;另 200 张选自 COCO 自然照片集,包含遮挡与复杂背景)。二元辨别任务流程为:被试注视中央点 300 ms,呈现测试图片 100 ms(视角 8°),空屏 100 ms,随后呈现目标物体与干扰物的规范视图供选择(人类点击,猕猴眼动)。人类被试 88 名(Amazon MTurk 平台,每张图片采集 80 份独立反应),实验猴 2 只(同步进行神经电生理记录)。行为指标采用一对多的信号检测敏感度 d′(I1 指标),人类与猕猴的分半信度分别为 0.84 与 0.88。与 AlexNet 逐图比较后界定:灵长类与模型 d′ 差值不超过 0.4 为对照图像(149 张),灵长类 d′ 至少高出 1.5 为挑战图像(266 张)。
神经记录与模型评估:在 2 只猕猴 IT 皮层(涵盖后、中、前部 PIT/CIT/AIT)植入多组 10×10 Utah 阵列,记录到 424 个有效多单元活动(MUA)位点,并在其中一只猴同侧半球记录上游 V4 区域(共 151 个位点)。测试图片呈现 100 ms,以刺激呈现后每 10 ms 无重叠时间窗构建群体活动向量,分别训练交叉验证的线性 SVM 解码器,获取神经解码准确率(NDA)随时间的演进曲线;采用非线性拟合确定 NDA 达到行为 d′ 水平的时刻作为该图的 OST(经 bootstrap 估计其标准误约为 9 ms)。计算模型端采用偏最小二乘回归将 DCNN 各层特征映射至 IT 各记录点,计算经噪声校正后的解释方差百分比(IT predictivity);同时测试了具备区内循环迭代的 CORnet 网络。此外设置了后向掩蔽实验以检验晚期信号的时序必要性。
主要结果
- 逐图像行为筛选确定挑战图像,且灵长类反应时显著延长。总体上猕猴与人类在测试集上的表现均优于 AlexNet;共筛出 149 张对照图像与 266 张挑战图像。两类图像在常规低阶统计属性上无单一显著分界,但在行为反应时上,挑战图像显著慢于对照图像(猕猴反应时增加 11.9 ms,t(413)=3.4,P<0.0001;人类增加 25 ms,t(413)=7.52,P<0.0001),提示其需要更长的神经加工时间(图 1d,e)。
- 挑战图像的 IT 解出时间平均滞后约 30 ms。约 91% 的挑战图像与 97% 的对照图像最终均能在 IT 群体中被解码达到行为水准;但对照图像的中位 OST 为 115 ± 1.4 ms,而挑战图像的中位 OST 为 145 ± 1.4 ms,二者相差约 30 ms(图 2c)。使用一半记录位点重估 OST 与全样本高度相关(Spearman R 达 0.76–0.77),且延迟量稳定维持在约 30 ms。
- 解码滞后无法归因于初始潜伏期延迟或低阶图像属性。对照组与挑战组图像诱发的 IT 群体起始潜伏期差异仅为 0.17 ± 0.21 ms(P=0.69),上游 V4 的起始与峰值潜伏期亦无组间差异(t(150)=0.2,P=0.8);单图的起始潜伏期与 OST 之间无显著相关(r=0.009,P=0.8)。挑战图像在约 150 ms 处的群体平均发放率反而高于对照图像(差异达 17.3%,P<0.0001)。通过 SHINE 工具箱均衡化低阶图像属性后,两组间 OST 差异仍保持在约 24 ms;对比度、空间模糊与杂乱度等参数仅能部分解释绝对 OST,无法解释两组间的 ΔOST;被动注视任务下仍观察到约 28 ms 的滞后,且在未受训动物数据中该延迟依然存在(图 3)。
- 前馈模型对晚期 IT 神经响应预测力下降,循环及更深网络预测更优。AlexNet 在早期响应时段(90–110 ms)可解释 44.3 ± 0.7% 的可解释方差,但在 150–200 ms 时段降至 20% 以下;该预测力下降的时间点与挑战图像的 OST 分布重合。层数更深的 CNN(Inception、ResNet)在晚期时段的解释方差显著高于浅层前馈模型(高出 5.8%,t(423)=14.26,P<0.0001);具备循环连接的 CORnet 表现出更高的晚期预测能力,其第 3、4 次循环迭代对晚期响应的拟合显著优于前两次迭代(图 4a,b)。以各模型自身未能正确分类的图片重新定义挑战集时,更深模型对应的未解图像在生物 IT 中表现出更长的 OST(图 4c)。
- 后向掩蔽实验证实晚期神经响应对挑战图像的识别行为具有必要性。在测试图片呈现后立即给予 500 ms 相位打乱的视觉掩蔽(用以干扰再入式反馈),掩蔽对挑战图像行为准确率的削弱显著大于对照图像:在图片呈现 34–167 ms 范围内,对照与挑战图像的辨别力差异显著存在;而当呈现时长延长至约 267 ms 时,掩蔽引入的组间差异完全消失(图 5)。
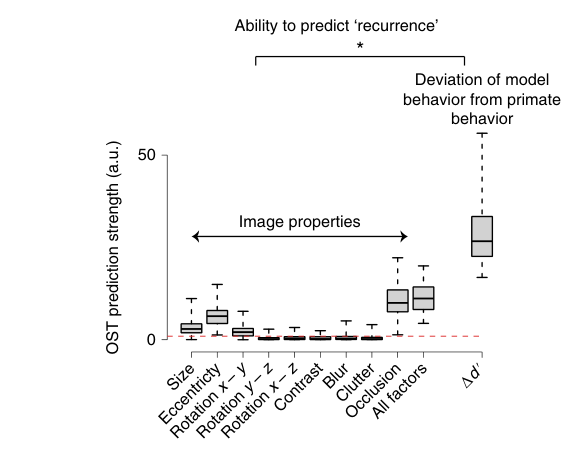
- 模型预测偏差(Δd′)对 OST 的预测力显著优于常规物理图像属性。图像尺寸、偏心度、遮挡比例等物理属性及各属性组合对 OST 的线性预测力较弱,而模型与灵长类行为表现的差异向量(Δd′)对 OST 展现出显著更强的预测能力(Spearman ρ=0.44,P<0.001;ANOVA F(1,10)>100,P<0.0001)(图 6)。
图注解读
图 1 · 行为筛选:找出挑战图像与对照图像
原文图注:Fig. 1 | Behavioral screening and identification of control and challenge images. a Both primates (humans and macaques) and feedforward DCNNs were tasked to identify which object is present in each test image (1,320 images). Top: the stages in the primate ventral visual pathway (retina, lateral geniculate nucleus (LGN), areas V1, V2, V4, and the IT cortex), which is implicated in core object recognition. We can conceptualize each stage as rapidly transforming the representation of the image and ultimately yielding the primates' behavior (that is, producing a behavioral report of which object was present). The blue arrows indicate the known anatomical feedforward projections from one area to the other. The red arrows indicate the known lateral and top-down recurrent connections. Bottom: a schematic of a similar pathway commonly present in DCNNs. These networks contain a series of convolutional and pooling layers with nonlinear transforms at each stage, followed by fully connected layers (which approximate macaque IT neural responses) that ultimately gives rise to the models' 'behavior'. Note that the DCNNs only have feedforward (blue) connections. b, Illustrations of the ten different object types used in the study. c, Binary object discrimination task, showing the timeline of events for each trial. Subjects fixate on a circle, then the test image at 8° containing one of ten possible objects is shown for 100 ms. After a 100-ms delay, a canonical view of the target object (the same as that presented in the test image) and a distractor object (one of the other nine objects) appears, and the human or monkey indicates which object was present in the test image by clicking on or making a saccade, respectively, to one of the two choices. d, Comparison of monkey performance (pooled across two monkeys) and DCNN performance (AlexNet19 fc7). Each circle represents the behavioral task performance (I1; refer to Methods) for a single image. We reliably identified challenge images (red circles) and control images (blue circles). Error bars are bootstrapped s.e.m. e, Examples of four challenge and four control images.
读法:图 a 展示了研究的概念框架:上部为灵长类腹侧通路,包含前馈连接(蓝箭头)与侧向及自上而下的循环连接(红箭头);下部为仅具前馈连接的标准 DCNN。图 c 展示任务时序(注视 300 ms → 刺激 100 ms → 延迟 100 ms → 选择 1500 ms)。图 d 为逐图行为辨别力散点图,横轴为模型预测 d′,纵轴为实验猴实际 d′,对角线附近的蓝点为对照图像,远离对角线且灵长类表现占优的红点为挑战图像。图 e 列出代表性刺激范例。该图对应主要结果第 1 条。
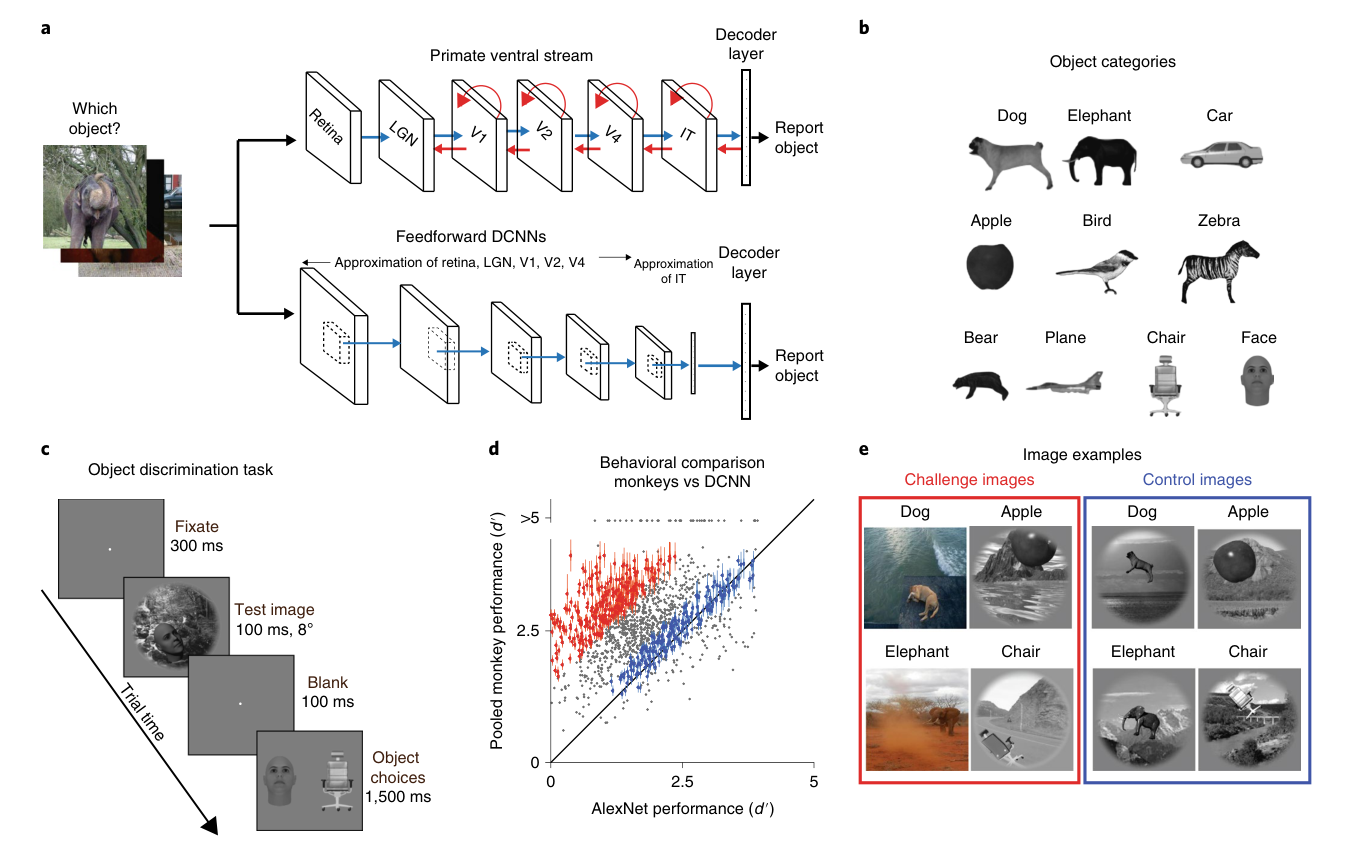
图 2 · IT 群体解码与逐图像解出时间(OST)
原文图注:Fig. 2 | Large-scale multiunit array recordings in the macaque IT cortex. a Schematic of array placement, neural data recording and OST estimation. We recorded extracellular voltage in the IT cortex (across the posterior, central and anterior inferior temporal cortices; PIT, CIT and AIT, respectively) from two monkeys, each hemisphere implanted with two or three Utah arrays. For each image presentation (100 ms), we counted multiunit spike events (see Methods for details), per site, in non-overlapping 10-ms windows, post stimulus onset, to construct a single population activity vector per time bin. These population vectors (image-evoked neural features) were then used to train and test cross-validated linear SVM decoders (d) separately per time bin. The decoder outputs per image (over time) were then used to perform a binary match to sample task and obtain NDAs at each time bin. An example of the neural decode accuracy over time is shown in the upper panel. The time at which the neural decodes equal the primate (monkey) performance is then recorded as the OST for that specific image. b, Examples of IT population decodes over time, with the estimated OSTs for four images: two control (top) and two challenge images (bottom). The red and blue circles represent the estimated neural decode accuracies at each time bins. The unbroken lines are nonlinear fits of the decoder accuracies over time (see Methods). The gray lines indicate the I1 performance of the primates (pooled monkey) for the specific images. Error bar indicates the bootstrapped s.e.m. c, Distribution of OSTs for control and challenge images. The median OSTs for control and challenge images are shown in the plot with broken lines. The inset on the top right shows the median evolution of IT decodes over time until the OST for control and challenge images.
读法:图 a 示意了多电极阵列在 PIT/CIT/AIT 的分布及 OST 计算流程(10 ms 窗口多单元活动 → 线性 SVM 解码 → 达到单图行为表现水平的时刻即为 OST)。图 b 列举了典型曲线,显示挑战图像解码达到行为准确率所需的时间明显滞后。图 c 绘制了两组图像 OST 的分布直方图,中位数差异约为 30 ms。本图支持主要结果第 2 条。
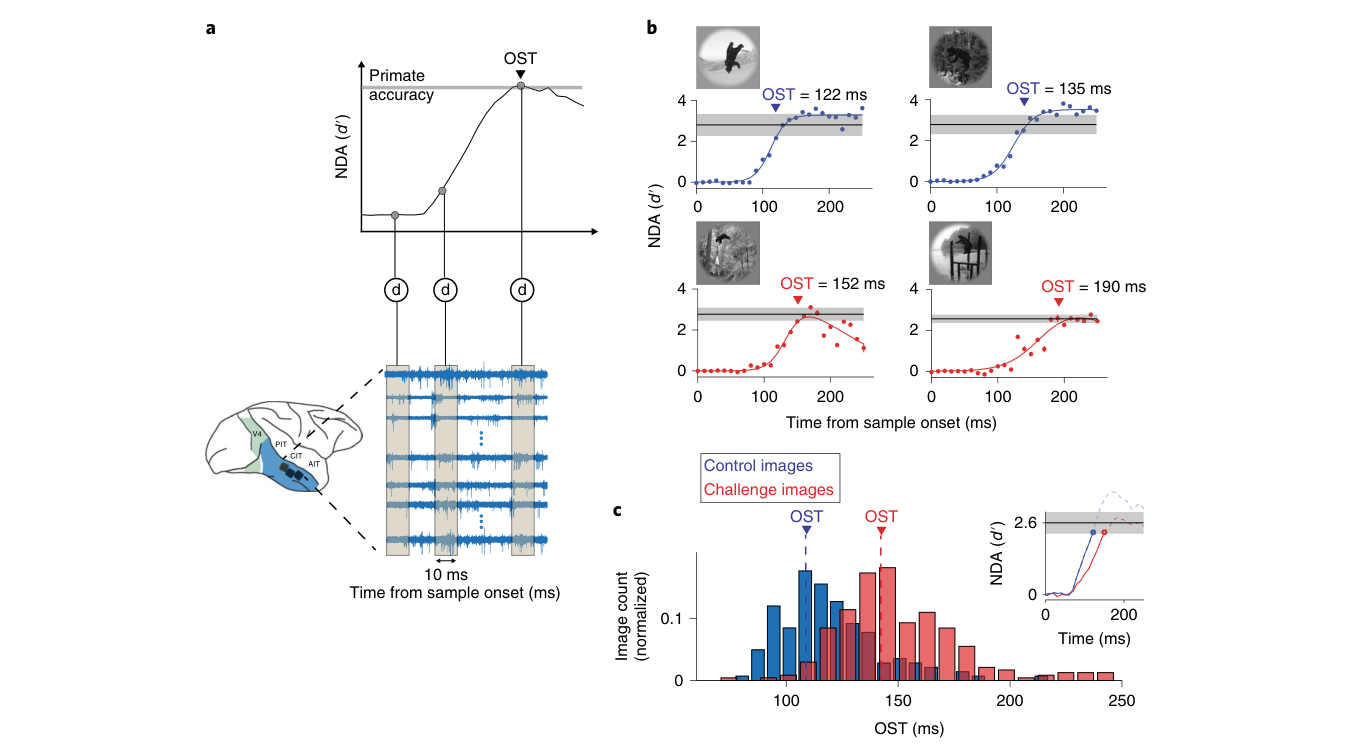
图 3 · 解出时间与神经响应潜伏期的关系
原文图注:Fig. 3 | Relationship between OSTs and neural response latencies. a Comparison of neural responses evoked by control (blue) and challenge (red) images. We estimated two measures of population response latency: population onset latency (tonset) and population peak latency (tpeak). b, Distributions of the population onset latencies (median across 424 sites), population peak response latencies (median across 424 sites) and OSTs for control images (n = 149). c, Same as in b but for challenge images (n = 266). d, Comparison of population onset latencies and OSTs for both control (blue; n = 149 images) and challenge images (red; n = 266 images). Vertical error bars show s.e.m. across neurons, and horizontal error bars show bootstrap (across trial repetition) standard deviations of OST estimates.
读法:图 a 比较对照与挑战图像诱发的平均放电率时程,两者在起始时段高度吻合,而在约 150 ms 处挑战图像诱发更强放电。图 b、c 展示起始潜伏期、峰值潜伏期与 OST 的分布对照。图 d 绘制了各单图的起始潜伏期与 OST 的散点关系,两者缺乏线性相关(r=0.009),排除了输入响应启动延迟导致 OST 滞后的假说。本图支持主要结果第 3 条。
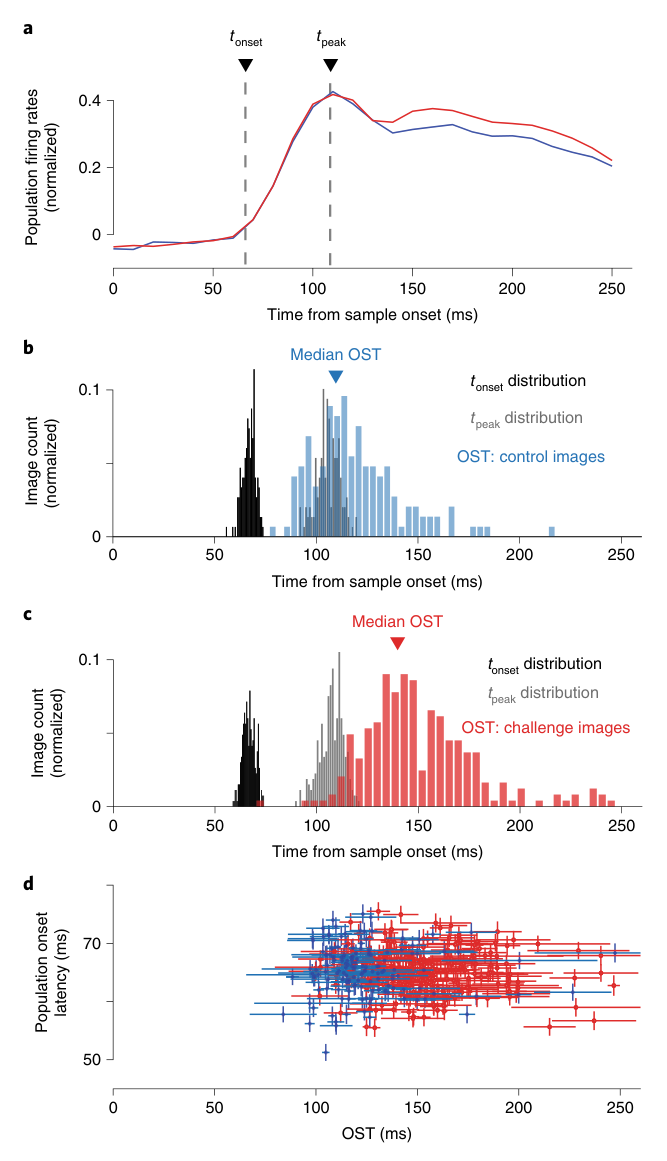
图 4 · 前馈模型对晚期 IT 响应预测失灵,更深与循环模型更好
原文图注:Fig. 4 | Predicting IT neural responses with DCNN features. a, IT predictivity of AlexNet's fc7 layer as a function of OST. For each time bin, we considered IT predictivity only for images that have a solution time equal to or higher than that time bin. Error bars indicate s.e.m. across neurons (n = 424 neurons considered for each time bin). Top: the distribution of OSTs for control (n = 149 images) and challenge (n = 266 images) images. b, IT predictivity computed separately for late OST images (OST > 150 ms, total of 349 images, n = 424 neurons) at the corresponding OSTs as a function of deep CNNs (AlexNet, Zeiler and Fergus, and VGG-S), deeper CNNs (Inception and ResNet) and deep-recurrent CNNs (CORnet). Circles indicate medians, and error bars indicate s.e.m. across neurons. Asterisks indicate a significant difference between two groups (obtained using paired t-tests). Deep (average of all three networks used) versus deeper CNNs (average of all four networks used): t(423) = 14.26, P < 0.0001. Deep (average of all three networks used) versus deep-recurrent (average of pass 3 and pass 4) CNNs: t(423) = 15.13, P < 0.0001. The inset to the right shows a schematic representation of CORnet that has recurrent connections (shown in red) at each layer (V1, V2, V4 and IT). For the boxplots, on each box, the central mark is the median, the edges of the box are the 25th and 75th percentiles, and the whiskers (W) extend to the most extreme data points that the algorithm considers not to be outliers. Outliers are data points that are larger than Q3 + W × (Q3 – Q1) or smaller than Q1 – W × (Q3 – Q1), where Q1 and Q3 are the 25th and 75th percentiles, respectively. Asterisk indicates a significant difference between two groups. c, Comparison of median OSTs for different sets of challenge images. The set of challenge images is defined with respect to each DCNN model. Thus, the exact set of images is different for each bar, the number of images is indicated on top of each bar, and the OST per image is plotted as a circle around each bar. In each case, the challenge images are defined as the set of images that remain unsolved by each model (using the fixed definitions of this study; see main text). Note that the use of deeper CNNs and the deep-recurrent CNN resulted in the discovery of challenge images that required even longer OSTs in the IT cortex than the original set challenge images (defined for AlexNet fc7).
读法:图 a 展示前馈网络预测力随响应时相的演变,在挑战图像大量解出的晚期阶段(150–200 ms)预测力明显滑落。图 b 针对晚期解出图像比较了浅层前馈、深层前馈与循环网络 CORnet 的预测表现,显示深层与循环结构能更有效地解释晚期神经方差。图 c 表明,针对各模型残留错误图像重新界定集合时,更深或含循环的模型其未解图像对应更长的神经 OST。本图支持主要结果第 4 条。
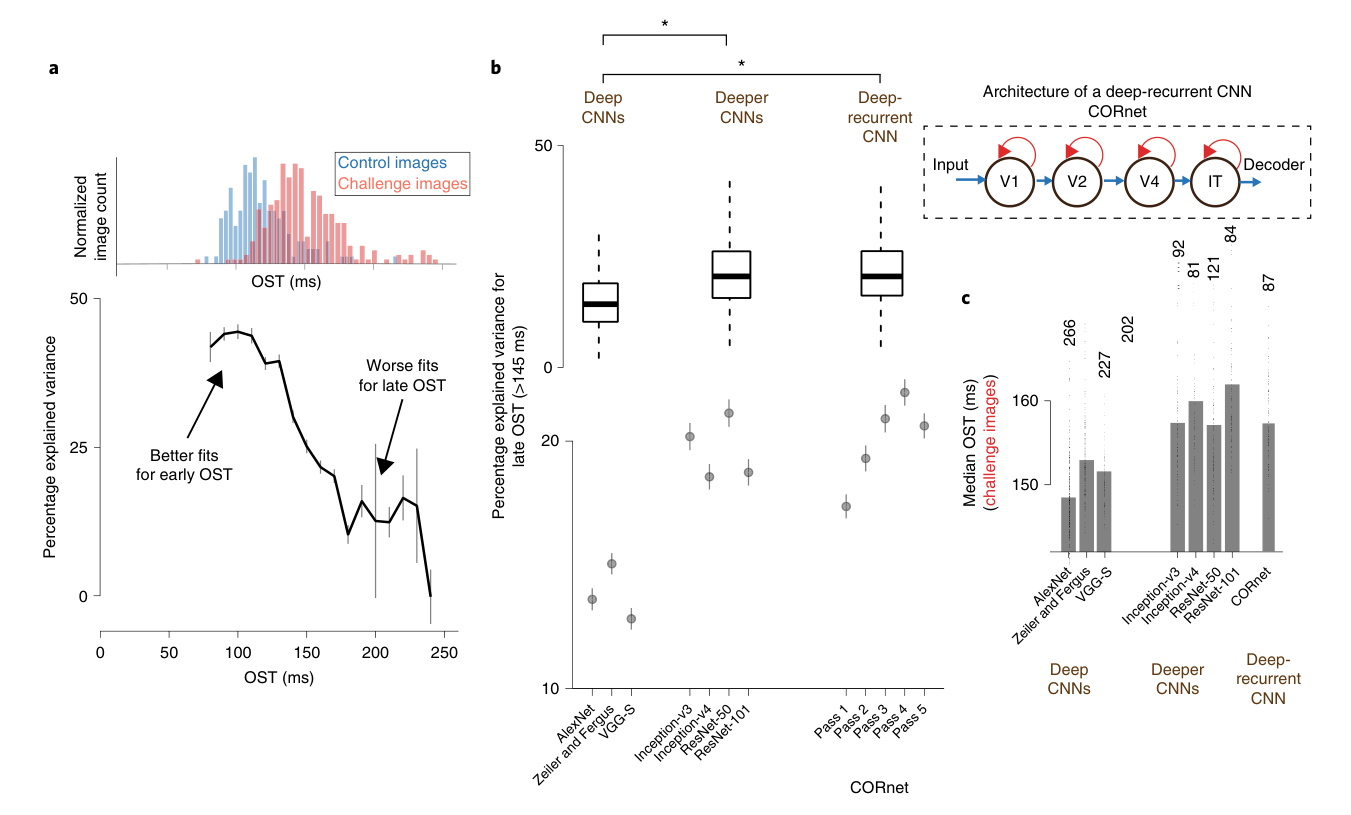
图 5 · 后向掩蔽对挑战图像的行为损伤更大
原文图注:Fig. 5 | Comparison of backward visual masking between challenge and control images. a, Binary object discrimination with backward visual masking. The test image (presented for 34, 67, 100, 134 or 267 ms) was followed immediately by a visual mask (phase-scrambled image) for 500 ms, followed by a blank gray screen for 100 ms, and then the object choice screen. Monkeys reported the target object by fixating it on the choice screen. b, Difference in behavioral performance between control and challenge images after backward visual masking. Each bar on the plot (y axis) is the difference in the pooled monkey performance during the visual masking task between the control and challenge images at the respective sample image presentation durations (x axis). The broken black line denotes the difference in performance between the control and challenge images without backward masking at the 100-ms presentation; n = 10 objects considered per presentation duration. Each circle corresponds to the difference in performance per object. The upper panel inset shows the raw performance (d') for the two groups of images. Error bars denote s.e.m. across all objects.
读法:图 a 示意掩蔽任务时序:测试图呈现不同时长(34–267 ms)后紧跟 500 ms 掩蔽刺激。图 b 横轴为图片呈现时间,纵轴为对照组与挑战组行为表现差值。在较短呈现时间内,掩蔽对挑战图像造成选择性抑制,差异显著大于无掩蔽基线;当呈现时间延长至 267 ms 时,掩蔽引入的额外行为损伤基本消除。该结果在行为学上支持晚期神经活动具有功能必要性,对应主要结果第 5 条。
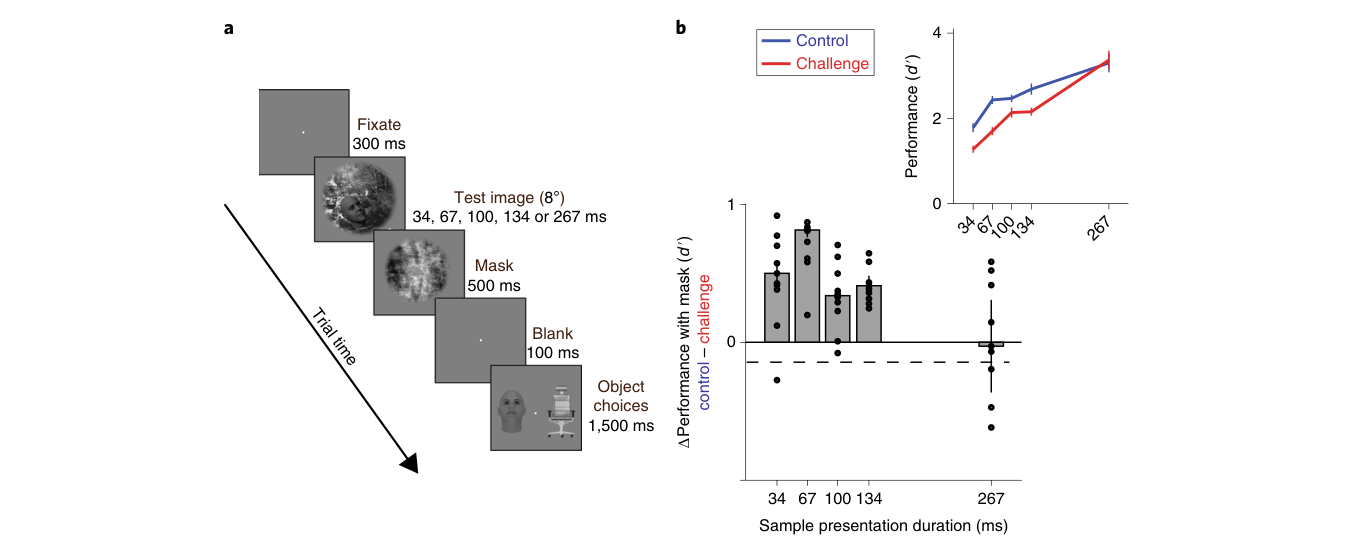
图 6 · 预测"循环参与":图像属性不如 Δd′ 向量
原文图注:Fig. 6 | Comparison of OST prediction strength. Comparisons were made between different image properties, a combination of all estimated image properties, and the Δd' vector (deviation of model behavior from pooled monkey behavior). Different image properties (n = 64 total: 32 high, 32 low; refer to Methods) for each image group was used. The red broken line denotes the significance threshold of the F-statistic. Image properties such as object size, eccentricity, presence of an occluder and a combination of these properties (referred to as All factors) significantly predict OST. However, the Δd' vector provided the strongest OST predictions. Error bars denote bootstrap standard deviations over images. The asterisk denotes a significant difference between the two groups, image properties versus Δd', estimated with repeated measures ANOVA (F(1,10) > 100, P < 0.0001; multiple-comparison using Turkey test showed a significant difference between Δd' and all other image properties). For the boxplot, on each box, the central mark is the median, the edges of the box are the 25th and 75th percentiles, and the whiskers extend to the most extreme data points that the algorithm considers not to be outliers. Outliers are defined as in Fig. 4b.
读法:箱线图展示各特征变量对单图 OST 预测能力的 F 统计量。尺寸、偏心度及遮挡等传统图像属性虽然具有统计显著性,但预测解释力有限;相比之下,计算模型预测偏差向量(Δd′)对 OST 展现出显著更强的解释能力(重复测量方差分析,P<0.0001),支持利用计算模型偏差指导神经环路检验。本图对应主要结果第 6 条。
讨论
作者提出的核心解释为:刺激诱发的晚期 IT 神经响应包含对核心物体识别行为至关重要的循环计算成分,而非无功能的伴随动态。后向掩蔽实验与行为准确率的时间依赖性证实,中断该晚期加工阶段将选择性损害针对困难图像的辨别。关于循环通路的潜在解剖定位,考虑到皮层间传递约需 10–15 ms,约 30 ms 的额外延迟相当于经历了两个以上的加工周期;其生物学底物可能包括 IT 与更早级视觉皮层(V4、V2)间的皮层反馈、来自前额叶或嗅周皮层的自上而下投射、IT 内部的局部横向循环,或是经由皮层下神经核团(如基底节)构成的环路,这些机制并非相互排斥。
研究的实证价值在于将笼统的反馈设想具象化为可量化检验的实验指标,且利用 Δd′ 和逐图 OST 向量能够预估哪些刺激更依赖特定反馈环路。作者指出,虽然计算模型偏差提供了有效的探针,但循环计算解决的具体变换问题仍需进一步解析;在理论上,时间维度的循环迭代可映射为等效权重的极深前馈变换,这提示生物腹侧流可能利用时间展开的循环回路实现了参数更为经济的非线性映射。文末指出了未来模型优化的参照基准:包括模型偏差向量、逐图 OST 分布以及晚期响应的特征空间,这将促使计算视觉模型超越固定的时间积分架构。
一句话总结
该研究构建了检验循环计算的操作体系:以模型失效的挑战图像为探针,以单图物体解出时间(OST)为神经指标,通过时间分辨解码与后向掩蔽实验证实了晚期 IT 神经活动对核心识别的功能必要性。需要指出的是,深层前馈模型亦能部分拟合晚期神经数据,表明基于反应滞后的生理证据尚不能完全区分纯解剖意义上的再入式循环与级联前馈非线性变换,环路细节仍需依赖靶向因果扰动实验做进一步确证。